
About the Journal
The Critical Care Science (Crit Care Sci), ISSN 2965-2774 (formerly Revista Brasileira de Terapia Intensiva), is a continuous publication of the Associação de Medicina Intensiva Brasileira (AMIB) and the Sociedade Portuguesa de Cuidados Intensivos (SPCI) and has the objective to disseminate high-quality clinical, epidemiological, translational, and health services research related to adult and pediatric critical care medicine.
-
Research Letter
Generalizing the application of machine learning predictive models across different populations: does a model to predict the use of renal replacement therapy in critically ill COVID-19 patients apply to general intensive care unit patients?
- Allan Rodrigo Murrieta França
 ,
, - Julia Nunes Cantarino,
- Jorge Ibrain Figueira Salluh ,
- Leonardo dos Santos Lourenço Bastos
Abstract
Research LetterGeneralizing the application of machine learning predictive models across different populations: does a model to predict the use of renal replacement therapy in critically ill COVID-19 patients apply to general intensive care unit patients?
Crit Care Sci. 2024;36:e20240285en
DOI 10.62675/2965-2774.20240285-pt
- Allan Rodrigo Murrieta França ,
- Julia Nunes Cantarino,
- Jorge Ibrain Figueira Salluh ,
- Leonardo dos Santos Lourenço Bastos
Views14TO THE EDITOR The widespread use of machine learning has created the possibility of generating robust prediction models for individual patients; however, caution is needed in their use for heterogeneous critically ill populations.() Recent literature has demonstrated major advances in the field of acute kidney injury prediction and the need for renal replacement therapy (RRT).() […]See moreViews14

Abstract
Research LetterGeneralizing the application of machine learning predictive models across different populations: does a model to predict the use of renal replacement therapy in critically ill COVID-19 patients apply to general intensive care unit patients?
Crit Care Sci. 2024;36:e20240285en
DOI 10.62675/2965-2774.20240285-pt
- Allan Rodrigo Murrieta França ,
- Julia Nunes Cantarino,
- Jorge Ibrain Figueira Salluh ,
- Leonardo dos Santos Lourenço Bastos
Views14TO THE EDITOR The widespread use of machine learning has created the possibility of generating robust prediction models for individual patients; however, caution is needed in their use for heterogeneous critically ill populations.() Recent literature has demonstrated major advances in the field of acute kidney injury prediction and the need for renal replacement therapy (RRT).() […]See more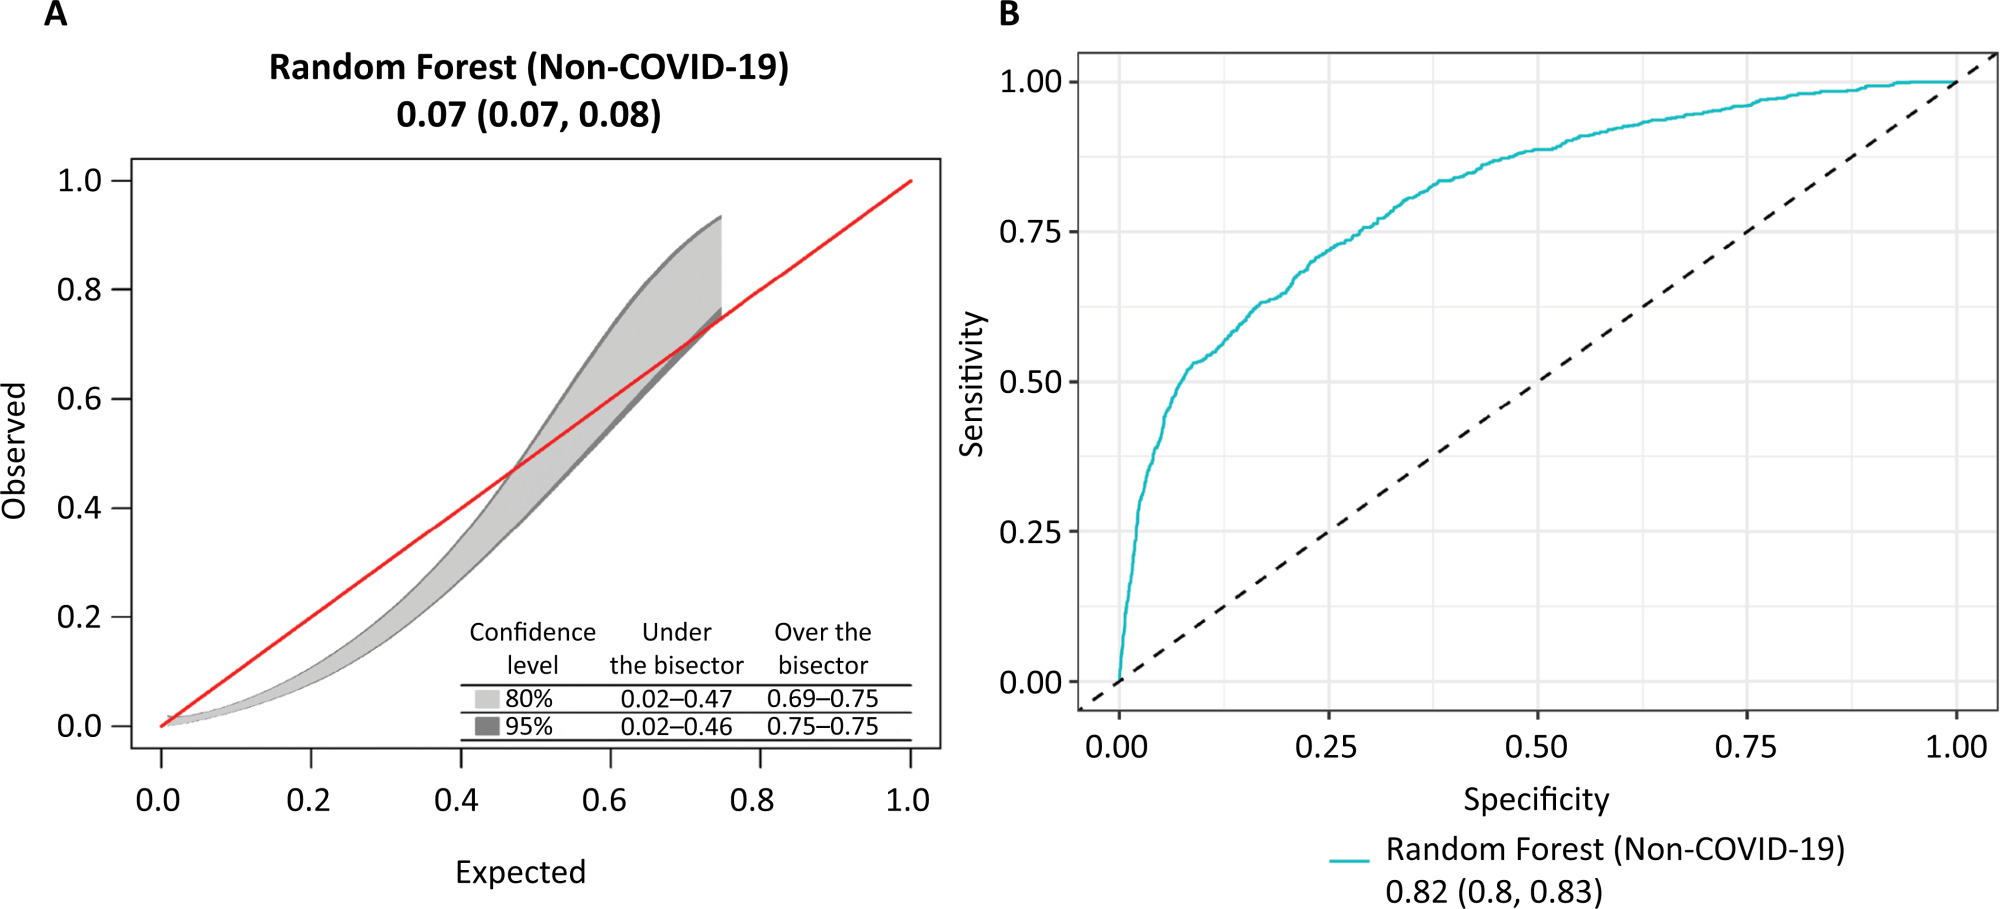
- Allan Rodrigo Murrieta França
-
Original Article
Conscious prone positioning in nonintubated COVID-19 patients with acute respiratory distress syndrome: systematic review and meta-analysis
- Gustavo Adolfo Vásquez-Tirado ,
- Edinson Dante Meregildo-Rodríguez ,
- Martha Genara Asmat-Rubio ,
- María José Salazar-Castillo ,
- Claudia Vanessa Quispe-Castañeda , [ … ],
- María del Carmen Cuadra-Campos
Abstract
Original ArticleConscious prone positioning in nonintubated COVID-19 patients with acute respiratory distress syndrome: systematic review and meta-analysis
Crit Care Sci. 2024;36:e20240176en
DOI 10.62675/2965-2774.20240176-en
- Gustavo Adolfo Vásquez-Tirado ,
- Edinson Dante Meregildo-Rodríguez ,
- Martha Genara Asmat-Rubio ,
- María José Salazar-Castillo ,
- Claudia Vanessa Quispe-Castañeda ,
- María del Carmen Cuadra-Campos
Views101See moreABSTRACT
Objective:
To systematically review the effect of the prone position on endotracheal intubation and mortality in nonintubated COVID-19 patients with acute respiratory distress syndrome.
Methods:
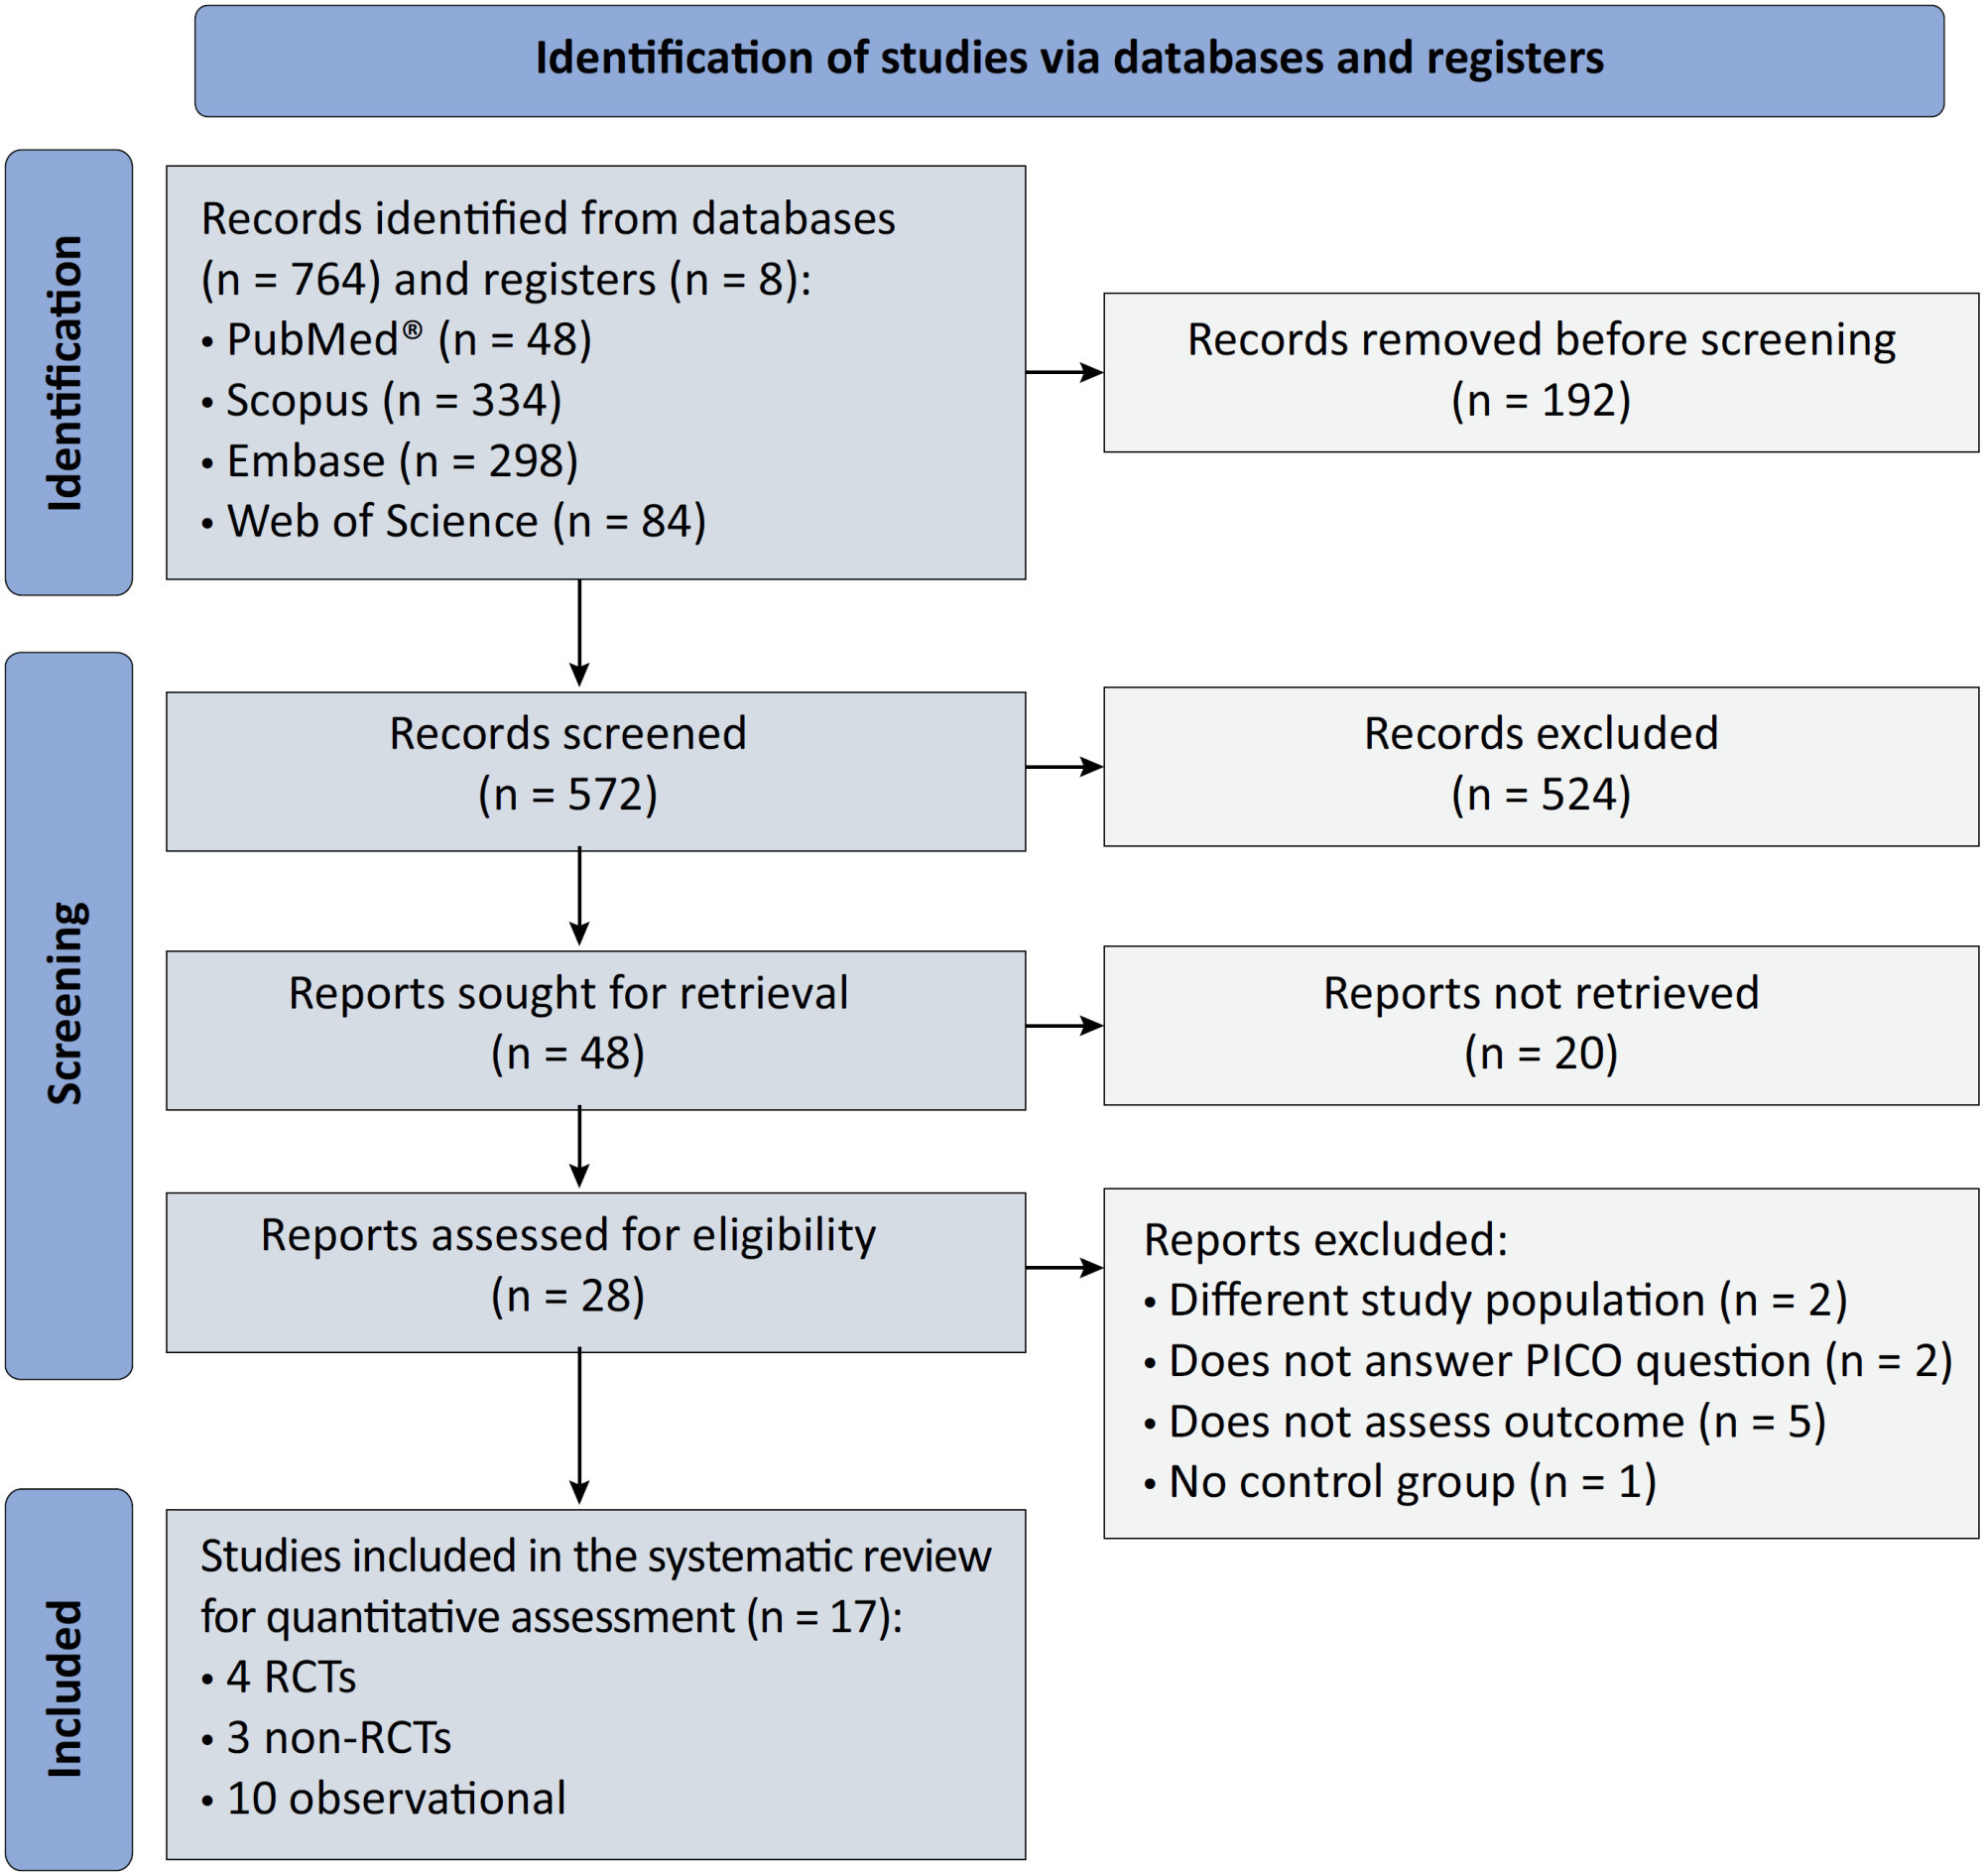
We registered the protocol (CRD42021286711) and searched for four databases and gray literature from inception to December 31, 2022. We included observational studies and clinical trials. There was no limit by date or the language of publication. We excluded case reports, case series, studies not available in full text, and those studies that included children < 18-years-old.
Results:
We included ten observational studies, eight clinical trials, 3,969 patients, 1,120 endotracheal intubation events, and 843 deaths. All of the studies had a low risk of bias (Newcastle-Ottawa Scale and Risk of Bias 2 tools). We found that the conscious prone position decreased the odds of endotracheal intubation by 44% (OR 0.56; 95%CI 0.40 – 0.78) and mortality by 43% (OR 0.57; 95%CI 0.39 – 0.84) in nonintubated COVID-19 patients with acute respiratory distress syndrome. This protective effect on endotracheal intubation and mortality was more robust in those who spent > 8 hours/day in the conscious prone position (OR 0.43; 95%CI 0.26 – 0.72 and OR 0.38; 95%CI 0.24 – 0.60, respectively). The certainty of the evidence according to the GRADE criteria was moderate.
Conclusion:
The conscious prone position decreased the odds of endotracheal intubation and mortality, especially when patients spent over 8 hours/day in the conscious prone position and treatment in the intensive care unit. However, our results should be cautiously interpreted due to limitations in evaluating randomized clinical trials, nonrandomized clinical trials and observational studies. However, despite systematic reviews with meta-analyses of randomized clinical trials, we must keep in mind that these studies remain heterogeneous from a clinical and methodological point of view.
Views101Abstract
Original ArticleConscious prone positioning in nonintubated COVID-19 patients with acute respiratory distress syndrome: systematic review and meta-analysis
Crit Care Sci. 2024;36:e20240176en
DOI 10.62675/2965-2774.20240176-en
- Gustavo Adolfo Vásquez-Tirado ,
- Edinson Dante Meregildo-Rodríguez ,
- Martha Genara Asmat-Rubio ,
- María José Salazar-Castillo ,
- Claudia Vanessa Quispe-Castañeda ,
- María del Carmen Cuadra-Campos
Views101See moreABSTRACT
Objective:
To systematically review the effect of the prone position on endotracheal intubation and mortality in nonintubated COVID-19 patients with acute respiratory distress syndrome.
Methods:
We registered the protocol (CRD42021286711) and searched for four databases and gray literature from inception to December 31, 2022. We included observational studies and clinical trials. There was no limit by date or the language of publication. We excluded case reports, case series, studies not available in full text, and those studies that included children < 18-years-old.
Results:
We included ten observational studies, eight clinical trials, 3,969 patients, 1,120 endotracheal intubation events, and 843 deaths. All of the studies had a low risk of bias (Newcastle-Ottawa Scale and Risk of Bias 2 tools). We found that the conscious prone position decreased the odds of endotracheal intubation by 44% (OR 0.56; 95%CI 0.40 – 0.78) and mortality by 43% (OR 0.57; 95%CI 0.39 – 0.84) in nonintubated COVID-19 patients with acute respiratory distress syndrome. This protective effect on endotracheal intubation and mortality was more robust in those who spent > 8 hours/day in the conscious prone position (OR 0.43; 95%CI 0.26 – 0.72 and OR 0.38; 95%CI 0.24 – 0.60, respectively). The certainty of the evidence according to the GRADE criteria was moderate.
Conclusion:
The conscious prone position decreased the odds of endotracheal intubation and mortality, especially when patients spent over 8 hours/day in the conscious prone position and treatment in the intensive care unit. However, our results should be cautiously interpreted due to limitations in evaluating randomized clinical trials, nonrandomized clinical trials and observational studies. However, despite systematic reviews with meta-analyses of randomized clinical trials, we must keep in mind that these studies remain heterogeneous from a clinical and methodological point of view.
- Gustavo Adolfo Vásquez-Tirado
-
Original Article
Efficacy of melatonin in decreasing the incidence of delirium in critically ill adults: a randomized controlled trial
- Anjishnujit Bandyopadhyay ,
- Lakshmi Narayana Yaddanapudi ,
- Vikas Saini ,
- Neeru Sahni ,
- Sandeep Grover , [ … ],
- Vighnesh Ashok
Abstract
Original ArticleEfficacy of melatonin in decreasing the incidence of delirium in critically ill adults: a randomized controlled trial
Crit Care Sci. 2024;36:e20240144en
DOI 10.62675/2965-2774.20240144-pt
- Anjishnujit Bandyopadhyay ,
- Lakshmi Narayana Yaddanapudi ,
- Vikas Saini ,
- Neeru Sahni ,
- Sandeep Grover ,
- Sunaakshi Puri ,
- Vighnesh Ashok
Views17See moreABSTRACT
Objective:
To determine whether enteral melatonin decreases the incidence of delirium in critically ill adults.
Methods:
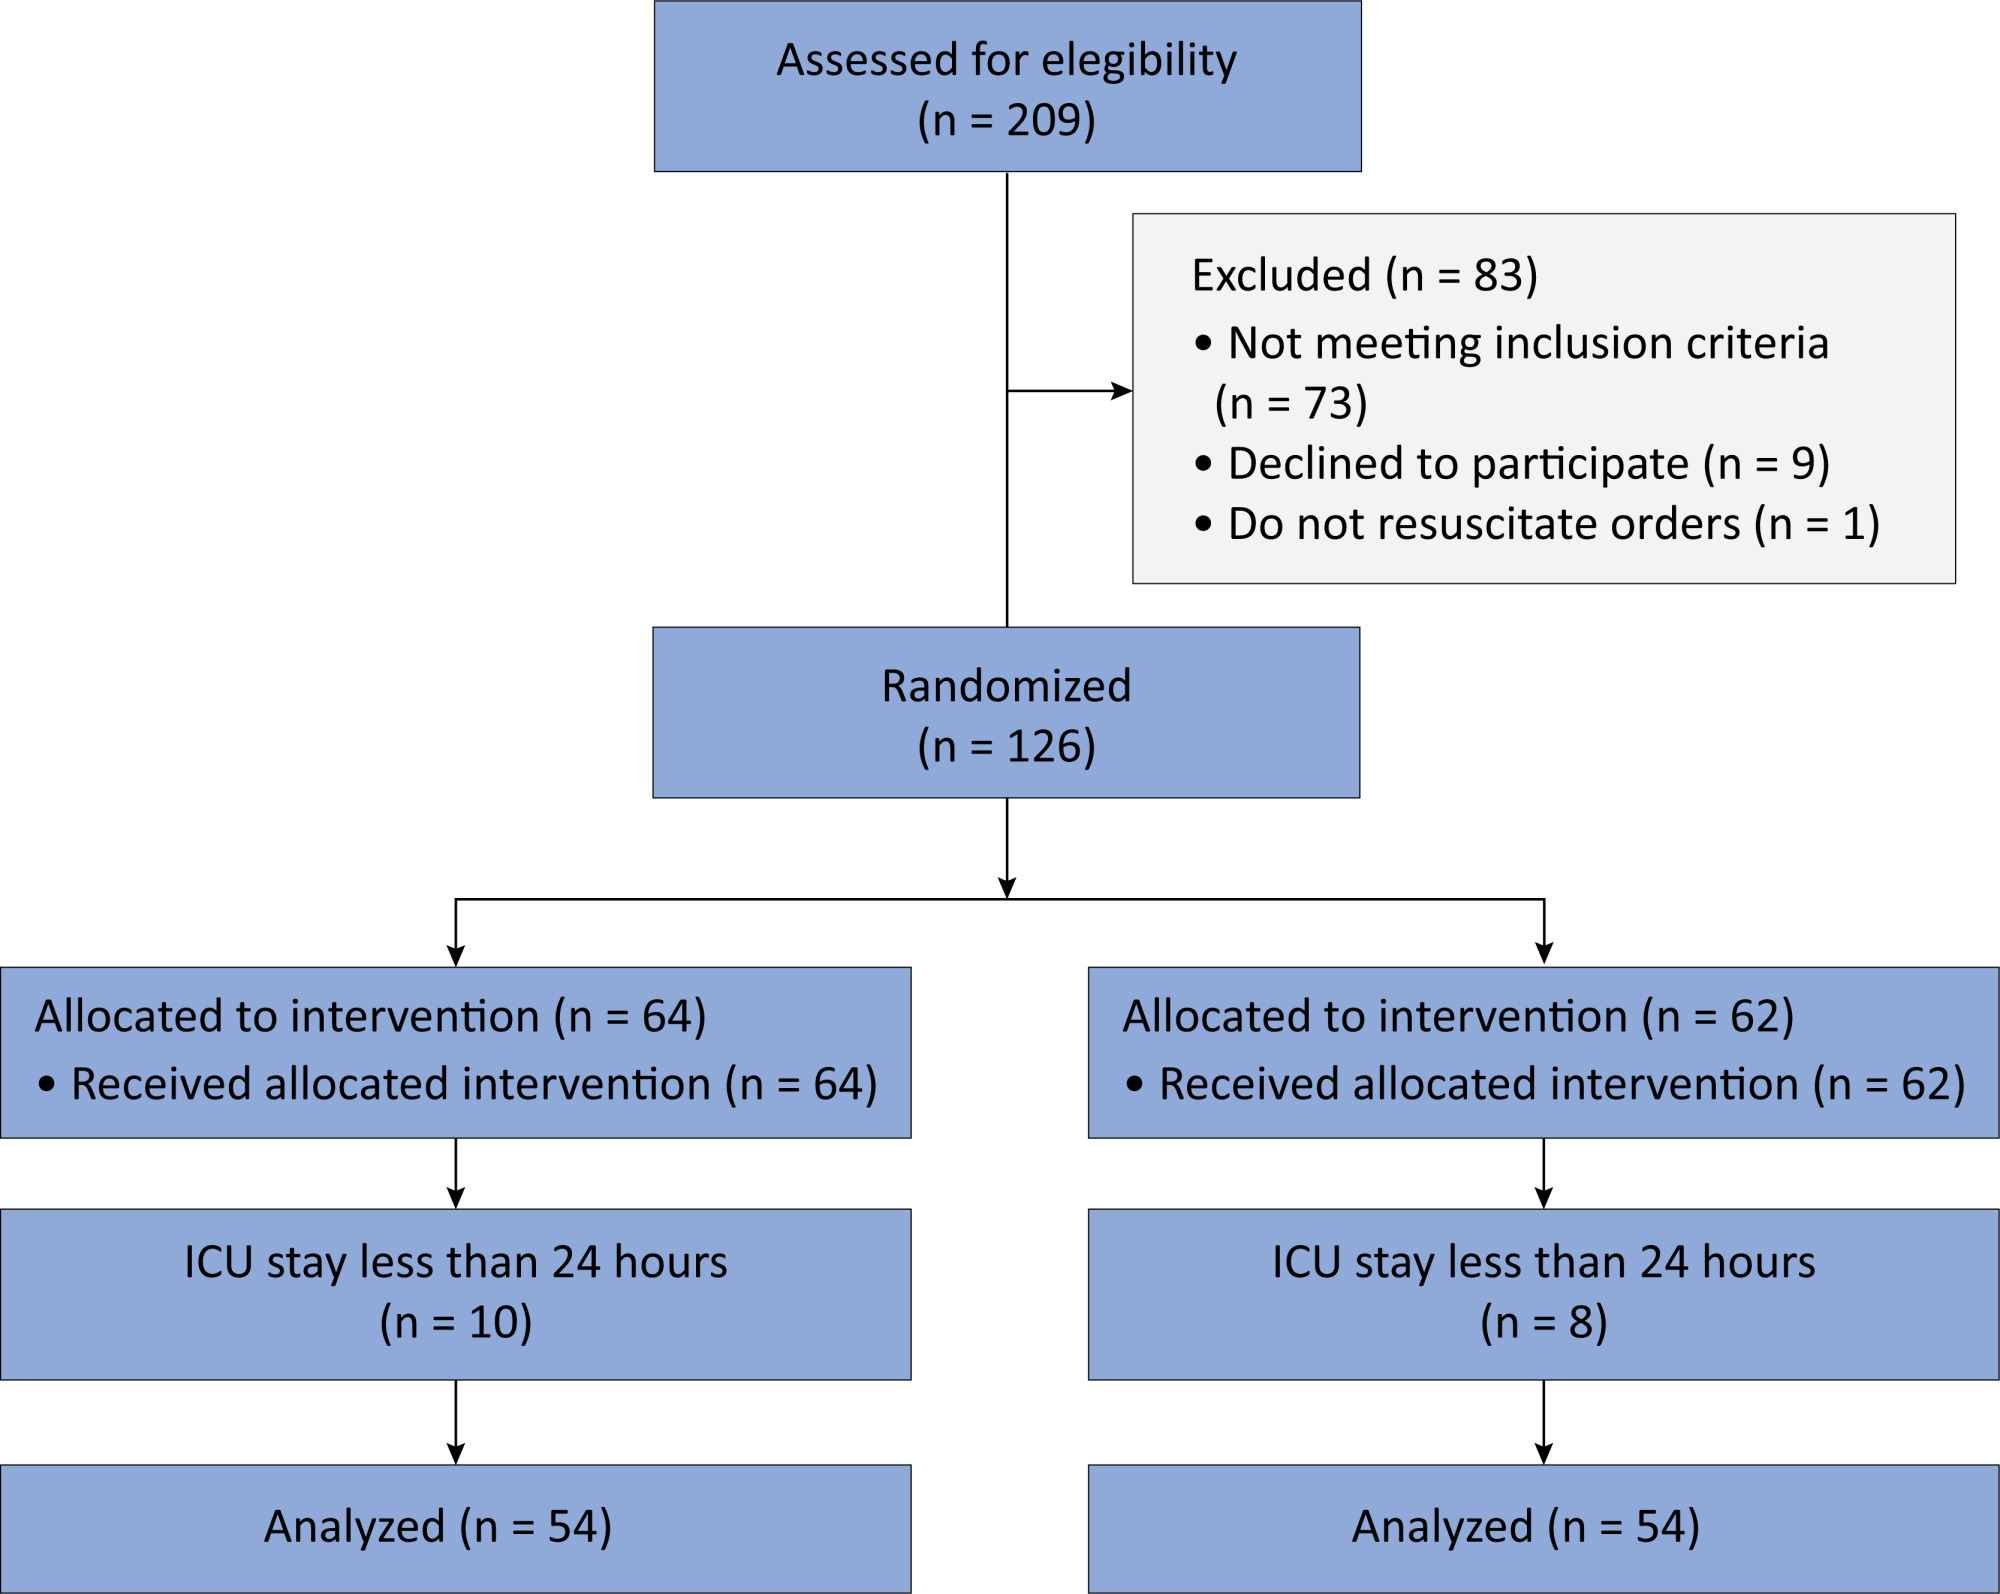
In this randomized controlled trial, adults were admitted to the intensive care unit and received either usual standard care alone (Control Group) or in combination with 3mg of enteral melatonin once a day at 9 PM (Melatonin Group). Concealment of allocation was done by serially numbered opaque sealed envelopes. The intensivist assessing delirium and the investigator performing the data analysis were blinded to the group allocation. The primary outcome was the incidence of delirium within 24 hours of the intensive care unit stay. The secondary outcomes were the incidence of delirium on Days 3 and 7, intensive care unit mortality, length of intensive care unit stay, duration of mechanical ventilation and Glasgow outcome score (at discharge).
Results:
We included 108 patients in the final analysis, with 54 patients in each group. At 24 hours of intensive care unit stay, there was no difference in the incidence of delirium between Melatonin and Control Groups (29.6 versus 46.2%; RR = 0.6; 95%CI 0.38 – 1.05; p = 0.11). No secondary outcome showed a statistically significant difference.
Conclusion:
Enteral melatonin 3mg is not more effective at decreasing the incidence of delirium than standard care is in critically ill adults.
Views17Abstract
Original ArticleEfficacy of melatonin in decreasing the incidence of delirium in critically ill adults: a randomized controlled trial
Crit Care Sci. 2024;36:e20240144en
DOI 10.62675/2965-2774.20240144-pt
- Anjishnujit Bandyopadhyay ,
- Lakshmi Narayana Yaddanapudi ,
- Vikas Saini ,
- Neeru Sahni ,
- Sandeep Grover ,
- Sunaakshi Puri ,
- Vighnesh Ashok
Views17See moreABSTRACT
Objective:
To determine whether enteral melatonin decreases the incidence of delirium in critically ill adults.
Methods:
In this randomized controlled trial, adults were admitted to the intensive care unit and received either usual standard care alone (Control Group) or in combination with 3mg of enteral melatonin once a day at 9 PM (Melatonin Group). Concealment of allocation was done by serially numbered opaque sealed envelopes. The intensivist assessing delirium and the investigator performing the data analysis were blinded to the group allocation. The primary outcome was the incidence of delirium within 24 hours of the intensive care unit stay. The secondary outcomes were the incidence of delirium on Days 3 and 7, intensive care unit mortality, length of intensive care unit stay, duration of mechanical ventilation and Glasgow outcome score (at discharge).
Results:
We included 108 patients in the final analysis, with 54 patients in each group. At 24 hours of intensive care unit stay, there was no difference in the incidence of delirium between Melatonin and Control Groups (29.6 versus 46.2%; RR = 0.6; 95%CI 0.38 – 1.05; p = 0.11). No secondary outcome showed a statistically significant difference.
Conclusion:
Enteral melatonin 3mg is not more effective at decreasing the incidence of delirium than standard care is in critically ill adults.
- Anjishnujit Bandyopadhyay
-
Viewpoint
Why the Sequential Organ Failure Assessment score needs updating?
Crit Care Sci. 2024;36:e20240296en
Abstract
ViewpointWhy the Sequential Organ Failure Assessment score needs updating?
Crit Care Sci. 2024;36:e20240296en
DOI 10.62675/2965-2774.20240296-pt
Views13The Sequential Organ Failure Assessment (SOFA) score was developed almost 30 years ago. It rapidly became one of the most widely used scoring systems in intensive care, both for clinical practice and research,(,) and remains one of the most cited scores in our speciality. Since its original description, there have been substantial changes in clinical […]See moreViews13Abstract
ViewpointWhy the Sequential Organ Failure Assessment score needs updating?
Crit Care Sci. 2024;36:e20240296en
DOI 10.62675/2965-2774.20240296-pt
Views13The Sequential Organ Failure Assessment (SOFA) score was developed almost 30 years ago. It rapidly became one of the most widely used scoring systems in intensive care, both for clinical practice and research,(,) and remains one of the most cited scores in our speciality. Since its original description, there have been substantial changes in clinical […]See more -
Original Article
A comprehensive physical functional assessment of survivors of critical care unit stay due to COVID-19
- Marcia Souza Volpe ,
- Ana Carolina Cardoso dos Santos ,
- Sílvia Gaspar ,
- Jade Lara de Melo ,
- Gabriela Harada , [ … ],
- Carlos Roberto Ribeiro de Carvalho
Abstract
Original ArticleA comprehensive physical functional assessment of survivors of critical care unit stay due to COVID-19
Crit Care Sci. 2024;36:e20240284en
DOI 10.5935/2965-2774.20240284-en
- Marcia Souza Volpe ,
- Ana Carolina Cardoso dos Santos ,
- Sílvia Gaspar ,
- Jade Lara de Melo ,
- Gabriela Harada ,
- Patrícia Rocha Alves Ferreira ,
- Karina Ramiceli Soares da Silva ,
- Natália Tiemi Simokomaki Souza ,
- Carlos Toufen Junior ,
- Luciana Dias Chiavegato ,
- Marcelo Britto Passos Amato ,
- Maria Ignez Zanetti Feltrim ,
- Carlos Roberto Ribeiro de Carvalho
Views12See moreABSTRACT
Objective:
To examine the physical function and respiratory muscle strength of patients – who recovered from critical COVID-19 – after intensive care unit discharge to the ward on Days one (D1) and seven (D7), and to investigate variables associated with functional impairment.
Methods:
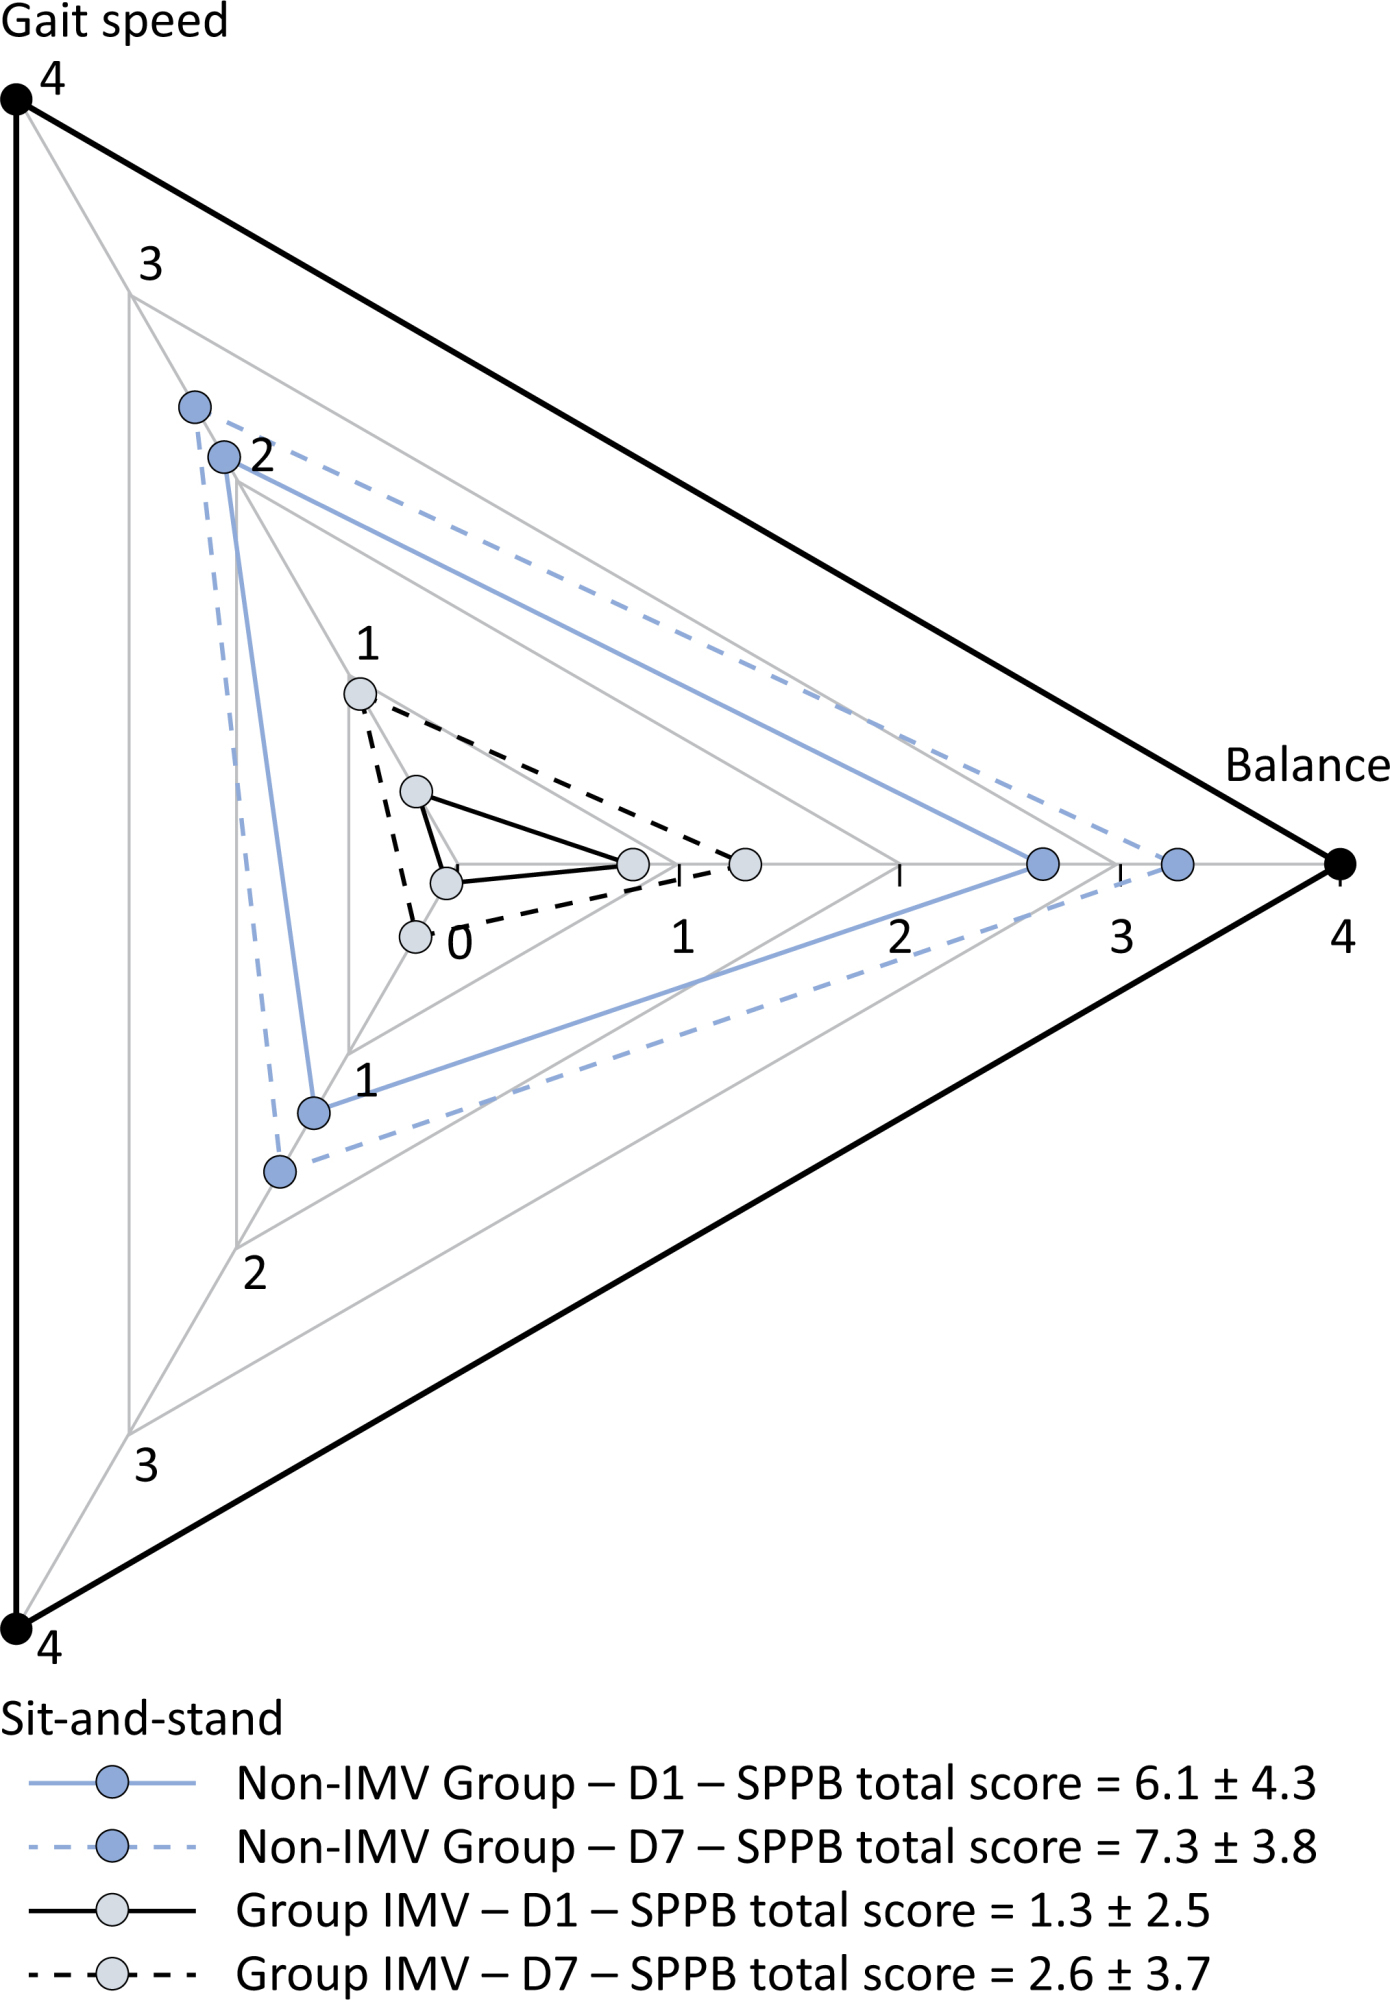
This was a prospective cohort study of adult patients with COVID-19 who needed invasive mechanical ventilation, non-invasive ventilation or high-flow nasal cannula and were discharged from the intensive care unit to the ward. Participants were submitted to Medical Research Council sum-score, handgrip strength, maximal inspiratory pressure, maximal expiratory pressure, and short physical performance battery tests. Participants were grouped into two groups according to their need for invasive ventilation: the Invasive Mechanical Ventilation Group (IMV Group) and the Non-Invasive Mechanical Ventilation Group (Non-IMV Group).
Results:
Patients in the IMV Group (n = 31) were younger and had higher Sequential Organ Failure Assessment scores than those in the Non-IMV Group (n = 33). The short physical performance battery scores (range 0 – 12) on D1 and D7 were 6.1 ± 4.3 and 7.3 ± 3.8, respectively for the Non-Invasive Mechanical Ventilation Group, and 1.3 ± 2.5 and 2.6 ± 3.7, respectively for the IMV Group. The prevalence of intensive care unit-acquired weakness on D7 was 13% for the Non-IMV Group and 72% for the IMV Group. The maximal inspiratory pressure, maximal expiratory pressure, and handgrip strength increased on D7 in both groups, but the maximal expiratory pressure and handgrip strength were still weak. Only maximal inspiratory pressure was recovered (i.e., > 80% of the predicted value) in the Non-IMV Group. Female sex, and the need and duration of invasive mechanical were independently and negatively associated with the short physical performance battery score and handgrip strength.
Conclusion:
Patients who recovered from critical COVID-19 and who received invasive mechanical ventilation presented greater disability than those who were not invasively ventilated. However, they both showed marginal functional improvement during early recovery, regardless of the need for invasive mechanical ventilation. This might highlight the severity of disability caused by SARS-CoV-2.
Views12Abstract
Original ArticleA comprehensive physical functional assessment of survivors of critical care unit stay due to COVID-19
Crit Care Sci. 2024;36:e20240284en
DOI 10.5935/2965-2774.20240284-en
- Marcia Souza Volpe ,
- Ana Carolina Cardoso dos Santos ,
- Sílvia Gaspar ,
- Jade Lara de Melo ,
- Gabriela Harada ,
- Patrícia Rocha Alves Ferreira ,
- Karina Ramiceli Soares da Silva ,
- Natália Tiemi Simokomaki Souza ,
- Carlos Toufen Junior ,
- Luciana Dias Chiavegato ,
- Marcelo Britto Passos Amato ,
- Maria Ignez Zanetti Feltrim ,
- Carlos Roberto Ribeiro de Carvalho
Views12See moreABSTRACT
Objective:
To examine the physical function and respiratory muscle strength of patients – who recovered from critical COVID-19 – after intensive care unit discharge to the ward on Days one (D1) and seven (D7), and to investigate variables associated with functional impairment.
Methods:
This was a prospective cohort study of adult patients with COVID-19 who needed invasive mechanical ventilation, non-invasive ventilation or high-flow nasal cannula and were discharged from the intensive care unit to the ward. Participants were submitted to Medical Research Council sum-score, handgrip strength, maximal inspiratory pressure, maximal expiratory pressure, and short physical performance battery tests. Participants were grouped into two groups according to their need for invasive ventilation: the Invasive Mechanical Ventilation Group (IMV Group) and the Non-Invasive Mechanical Ventilation Group (Non-IMV Group).
Results:
Patients in the IMV Group (n = 31) were younger and had higher Sequential Organ Failure Assessment scores than those in the Non-IMV Group (n = 33). The short physical performance battery scores (range 0 – 12) on D1 and D7 were 6.1 ± 4.3 and 7.3 ± 3.8, respectively for the Non-Invasive Mechanical Ventilation Group, and 1.3 ± 2.5 and 2.6 ± 3.7, respectively for the IMV Group. The prevalence of intensive care unit-acquired weakness on D7 was 13% for the Non-IMV Group and 72% for the IMV Group. The maximal inspiratory pressure, maximal expiratory pressure, and handgrip strength increased on D7 in both groups, but the maximal expiratory pressure and handgrip strength were still weak. Only maximal inspiratory pressure was recovered (i.e., > 80% of the predicted value) in the Non-IMV Group. Female sex, and the need and duration of invasive mechanical were independently and negatively associated with the short physical performance battery score and handgrip strength.
Conclusion:
Patients who recovered from critical COVID-19 and who received invasive mechanical ventilation presented greater disability than those who were not invasively ventilated. However, they both showed marginal functional improvement during early recovery, regardless of the need for invasive mechanical ventilation. This might highlight the severity of disability caused by SARS-CoV-2.
- Marcia Souza Volpe
-
Original Article
Association of biomarkers with successful ventilatory weaning in COVID-19 patients: an observational study
Crit Care Sci. 2024;36:e20240158en
Abstract
Original ArticleAssociation of biomarkers with successful ventilatory weaning in COVID-19 patients: an observational study
Crit Care Sci. 2024;36:e20240158en
DOI 10.62675/2965-2774.20240158-pt
Views4ABSTRACT
Objective:
To evaluate the association of biomarkers with successful ventilatory weaning in COVID-19 patients.
Methods:
An observational, retrospective, and single-center study was conducted between March 2020 and April 2021. C-reactive protein, total lymphocytes, and the neutrophil/lymphocyte ratio were evaluated during attrition and extubation, and the variation in these biomarker values was measured. The primary outcome was successful extubation. ROC curves were drawn to find the best cutoff points for the biomarkers based on sensitivity and specificity. Statistical analysis was performed using logistic regression.
Results:
Of the 2,377 patients admitted to the intensive care unit, 458 were included in the analysis, 356 in the Successful Weaning Group and 102 in the Failure Group. The cutoff points found from the ROC curves were −62.4% for C-reactive protein, +45.7% for total lymphocytes, and −32.9% for neutrophil/lymphocyte ratio. These points were significantly associated with greater extubation success. In the multivariate analysis, only C-reactive protein variation remained statistically significant (OR 2.6; 95%CI 1.51 – 4.5; p < 0.001).
Conclusion:
In this study, a decrease in C-reactive protein levels was associated with successful extubation in COVID-19 patients. Total lymphocytes and the neutrophil/lymphocyte ratio did not maintain the association after multivariate analysis. However, a decrease in C-reactive protein levels should not be used as a sole variable to identify COVID-19 patients suitable for weaning; as in our study, the area under the ROC curve demonstrated poor accuracy in discriminating extubation outcomes, with low sensitivity and specificity.
Keywords:Airway extubationartificialBiomarkersCoronavirus infectionsCOVID-19Intensive care unitsintratrachealIntubationRespirationVentilator weaningSee moreViews4Abstract
Original ArticleAssociation of biomarkers with successful ventilatory weaning in COVID-19 patients: an observational study
Crit Care Sci. 2024;36:e20240158en
DOI 10.62675/2965-2774.20240158-pt
Views4ABSTRACT
Objective:
To evaluate the association of biomarkers with successful ventilatory weaning in COVID-19 patients.
Methods:
An observational, retrospective, and single-center study was conducted between March 2020 and April 2021. C-reactive protein, total lymphocytes, and the neutrophil/lymphocyte ratio were evaluated during attrition and extubation, and the variation in these biomarker values was measured. The primary outcome was successful extubation. ROC curves were drawn to find the best cutoff points for the biomarkers based on sensitivity and specificity. Statistical analysis was performed using logistic regression.
Results:
Of the 2,377 patients admitted to the intensive care unit, 458 were included in the analysis, 356 in the Successful Weaning Group and 102 in the Failure Group. The cutoff points found from the ROC curves were −62.4% for C-reactive protein, +45.7% for total lymphocytes, and −32.9% for neutrophil/lymphocyte ratio. These points were significantly associated with greater extubation success. In the multivariate analysis, only C-reactive protein variation remained statistically significant (OR 2.6; 95%CI 1.51 – 4.5; p < 0.001).
Conclusion:
In this study, a decrease in C-reactive protein levels was associated with successful extubation in COVID-19 patients. Total lymphocytes and the neutrophil/lymphocyte ratio did not maintain the association after multivariate analysis. However, a decrease in C-reactive protein levels should not be used as a sole variable to identify COVID-19 patients suitable for weaning; as in our study, the area under the ROC curve demonstrated poor accuracy in discriminating extubation outcomes, with low sensitivity and specificity.
Keywords:Airway extubationartificialBiomarkersCoronavirus infectionsCOVID-19Intensive care unitsintratrachealIntubationRespirationVentilator weaningSee more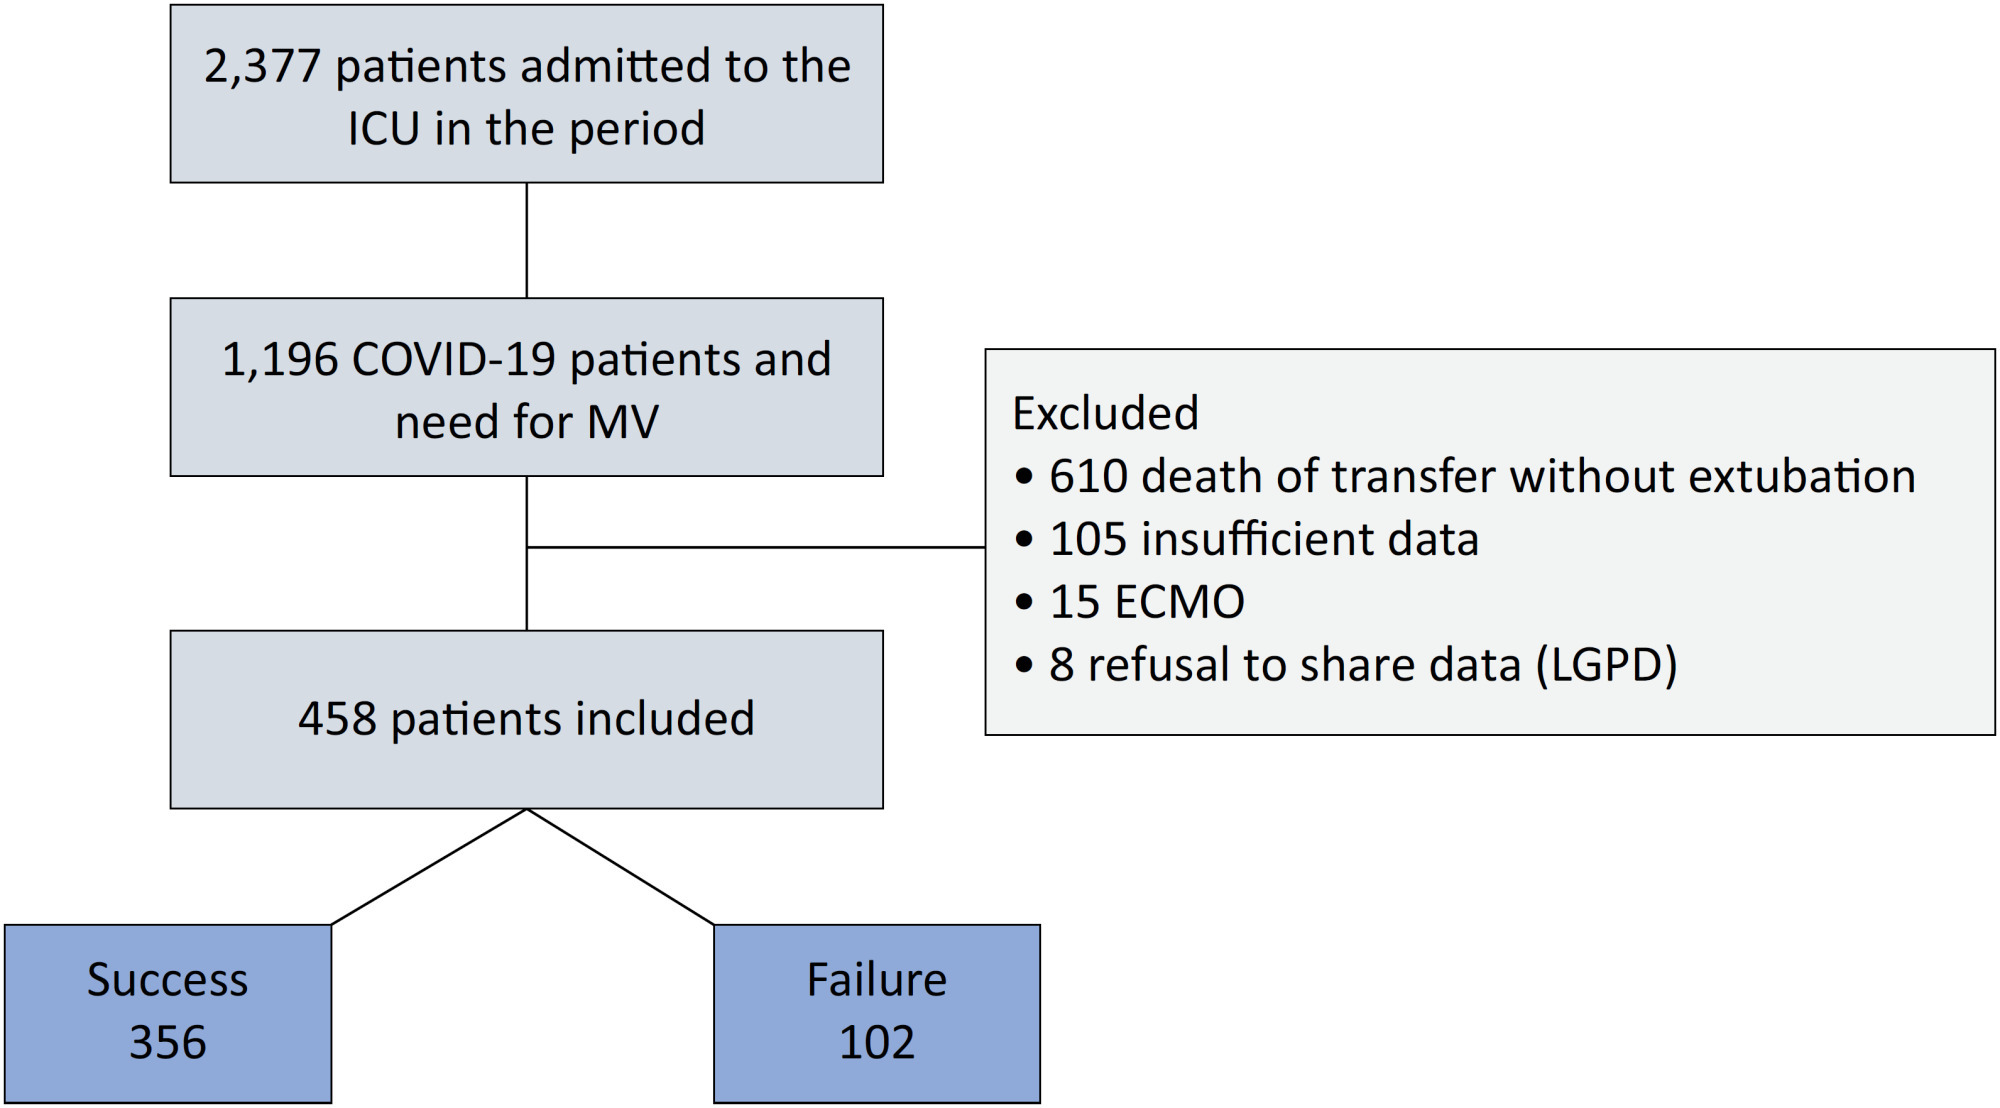
-
Research Letter
COVID-19 underpinning the inverse equity hypothesis between public and private health care in Brazil
Crit Care Sci. 2024;36:e20240294en
Abstract
Research LetterCOVID-19 underpinning the inverse equity hypothesis between public and private health care in Brazil
Crit Care Sci. 2024;36:e20240294en
DOI 10.62675/2965-2774.20240294-pt
Views6Since 1990, the Brazilian public health care system, known as the Unified Health System (SUS – Sistema Único de Saúde), has provided free health care services to all individuals throughout the country. However, approximately 24.9% of the Brazilian population has the financial means to afford private health care alternatives.() Equity, a fundamental principle of SUS, […]See moreViews6Abstract
Research LetterCOVID-19 underpinning the inverse equity hypothesis between public and private health care in Brazil
Crit Care Sci. 2024;36:e20240294en
DOI 10.62675/2965-2774.20240294-pt
Views6Since 1990, the Brazilian public health care system, known as the Unified Health System (SUS – Sistema Único de Saúde), has provided free health care services to all individuals throughout the country. However, approximately 24.9% of the Brazilian population has the financial means to afford private health care alternatives.() Equity, a fundamental principle of SUS, […]See more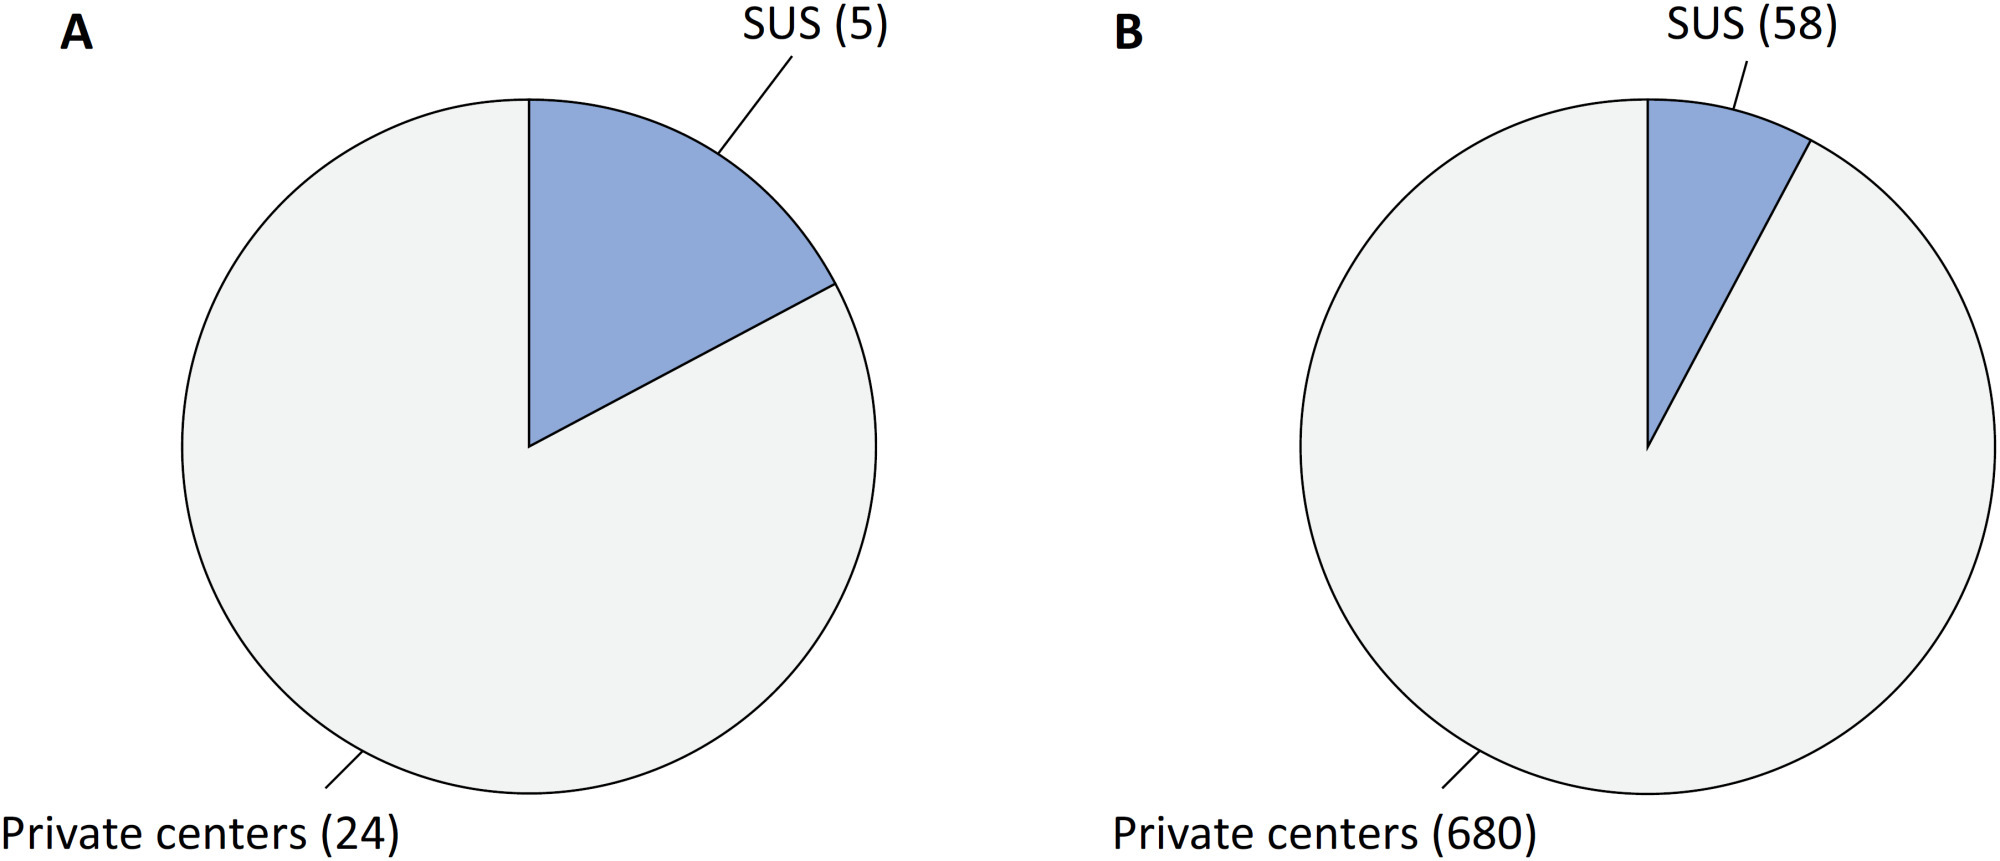
-
Clinical Report
Topical glyceryl trinitrate to increase radial artery diameter in neonates: study protocol for a randomized controlled trial
Crit Care Sci. 2024;36:e20240235en
Abstract
Clinical ReportTopical glyceryl trinitrate to increase radial artery diameter in neonates: study protocol for a randomized controlled trial
Crit Care Sci. 2024;36:e20240235en
DOI 10.62675/2965-2774.20240235-pt
Views3ABSTRACT
Background:
Newborn infants admitted to the neonatal intensive care unit require arterial cannulation for hemodynamic monitoring and blood sampling. Arterial access is achieved through catheterization of umbilical or peripheral arteries. Peripheral artery cannulation is performed in critically ill newborns, but artery localization and cannulation is often challenging and unsuccessful. Therefore, increasing the internal diameter and preventing vasospasm are important for successful peripheral artery cannulation in neonates. Topical glyceryl trinitrate has the potential to increase cannulation success by relaxing arterial smooth muscles and thus increasing the internal diameter. We aim to conduct a pilot randomized controlled trial to evaluate the efficacy and safety of topycal glyceryl trinitrate in increasing the diameter of the radial artery in neonates.
Methods/Design:
This study will be a single-center, observer-blind, randomized, placebo-controlled trial conducted in the neonatal intensive care unit of Perth Children’s Hospital, Western Australia. A total of 60 infants born at >34 weeks of gestation who are admitted for elective surgery or medical reasons and for whom a peripheral arterial line is needed for sampling or blood pressure monitoring will be recruited after informed parental consent is obtained. The primary outcome will be the change in radial arterial diameter from baseline to postintervention. Secondary outcomes will be the absolute and percentage change from baseline in the radial arterial diameter in both limbs and safety (hypotension and methemoglobinemia).
Discussion:
This will be the first randomized controlled trial evaluating the use of topical glyceryl trinitrate to facilitate peripheral artery cannulation in neonates. If our pilot randomized controlled trial confirms the benefits of glyceryl trinitrate patches, it will pave the way for large multicenter randomized controlled trials in this field.
Keywords:Catheterization, peripheralInfantInfant, newbornIntensive care units, neonatalNitroglycerinRadial arterySee moreViews3Abstract
Clinical ReportTopical glyceryl trinitrate to increase radial artery diameter in neonates: study protocol for a randomized controlled trial
Crit Care Sci. 2024;36:e20240235en
DOI 10.62675/2965-2774.20240235-pt
Views3ABSTRACT
Background:
Newborn infants admitted to the neonatal intensive care unit require arterial cannulation for hemodynamic monitoring and blood sampling. Arterial access is achieved through catheterization of umbilical or peripheral arteries. Peripheral artery cannulation is performed in critically ill newborns, but artery localization and cannulation is often challenging and unsuccessful. Therefore, increasing the internal diameter and preventing vasospasm are important for successful peripheral artery cannulation in neonates. Topical glyceryl trinitrate has the potential to increase cannulation success by relaxing arterial smooth muscles and thus increasing the internal diameter. We aim to conduct a pilot randomized controlled trial to evaluate the efficacy and safety of topycal glyceryl trinitrate in increasing the diameter of the radial artery in neonates.
Methods/Design:
This study will be a single-center, observer-blind, randomized, placebo-controlled trial conducted in the neonatal intensive care unit of Perth Children’s Hospital, Western Australia. A total of 60 infants born at >34 weeks of gestation who are admitted for elective surgery or medical reasons and for whom a peripheral arterial line is needed for sampling or blood pressure monitoring will be recruited after informed parental consent is obtained. The primary outcome will be the change in radial arterial diameter from baseline to postintervention. Secondary outcomes will be the absolute and percentage change from baseline in the radial arterial diameter in both limbs and safety (hypotension and methemoglobinemia).
Discussion:
This will be the first randomized controlled trial evaluating the use of topical glyceryl trinitrate to facilitate peripheral artery cannulation in neonates. If our pilot randomized controlled trial confirms the benefits of glyceryl trinitrate patches, it will pave the way for large multicenter randomized controlled trials in this field.
Keywords:Catheterization, peripheralInfantInfant, newbornIntensive care units, neonatalNitroglycerinRadial arterySee more
-
Letter to the Editor
To: Posterior reversible encephalopathy syndrome in a child with severe multisystem inflammatory syndrome due to COVID-19
Crit Care Sci. 2023;35(4):427-428
Abstract
Letter to the EditorTo: Posterior reversible encephalopathy syndrome in a child with severe multisystem inflammatory syndrome due to COVID-19
Crit Care Sci. 2023;35(4):427-428
DOI 10.5935/2965-2774.20230283-pt
Views142To the editorWe read with interest the article by Dominguez-Rojas et al. about a severe acute respiratory syndrome coronavirus 2 (SARS-CoV-2) polymerase chain reaction (PCR)-negative 9-year-old male who underwent laparotomy for suspected acute abdomen (vomiting, abdominal pain, diarrhea), which was noninformative.() On postoperative day one, the patient experienced respiratory insufficiency attributed to pneumonia with pleural […]See moreViews142Abstract
Letter to the EditorTo: Posterior reversible encephalopathy syndrome in a child with severe multisystem inflammatory syndrome due to COVID-19
Crit Care Sci. 2023;35(4):427-428
DOI 10.5935/2965-2774.20230283-pt
Views142To the editorWe read with interest the article by Dominguez-Rojas et al. about a severe acute respiratory syndrome coronavirus 2 (SARS-CoV-2) polymerase chain reaction (PCR)-negative 9-year-old male who underwent laparotomy for suspected acute abdomen (vomiting, abdominal pain, diarrhea), which was noninformative.() On postoperative day one, the patient experienced respiratory insufficiency attributed to pneumonia with pleural […]See more -
Original Article
Conscious prone positioning in nonintubated COVID-19 patients with acute respiratory distress syndrome: systematic review and meta-analysis
- Gustavo Adolfo Vásquez-Tirado ,
- Edinson Dante Meregildo-Rodríguez ,
- Martha Genara Asmat-Rubio ,
- María José Salazar-Castillo ,
- Claudia Vanessa Quispe-Castañeda , [ … ],
- María del Carmen Cuadra-Campos
Abstract
Original ArticleConscious prone positioning in nonintubated COVID-19 patients with acute respiratory distress syndrome: systematic review and meta-analysis
Crit Care Sci. 2024;36:e20240176en
DOI 10.62675/2965-2774.20240176-en
- Gustavo Adolfo Vásquez-Tirado ,
- Edinson Dante Meregildo-Rodríguez ,
- Martha Genara Asmat-Rubio ,
- María José Salazar-Castillo ,
- Claudia Vanessa Quispe-Castañeda ,
- María del Carmen Cuadra-Campos
Views101See moreABSTRACT
Objective:
To systematically review the effect of the prone position on endotracheal intubation and mortality in nonintubated COVID-19 patients with acute respiratory distress syndrome.
Methods:
We registered the protocol (CRD42021286711) and searched for four databases and gray literature from inception to December 31, 2022. We included observational studies and clinical trials. There was no limit by date or the language of publication. We excluded case reports, case series, studies not available in full text, and those studies that included children < 18-years-old.
Results:
We included ten observational studies, eight clinical trials, 3,969 patients, 1,120 endotracheal intubation events, and 843 deaths. All of the studies had a low risk of bias (Newcastle-Ottawa Scale and Risk of Bias 2 tools). We found that the conscious prone position decreased the odds of endotracheal intubation by 44% (OR 0.56; 95%CI 0.40 – 0.78) and mortality by 43% (OR 0.57; 95%CI 0.39 – 0.84) in nonintubated COVID-19 patients with acute respiratory distress syndrome. This protective effect on endotracheal intubation and mortality was more robust in those who spent > 8 hours/day in the conscious prone position (OR 0.43; 95%CI 0.26 – 0.72 and OR 0.38; 95%CI 0.24 – 0.60, respectively). The certainty of the evidence according to the GRADE criteria was moderate.
Conclusion:
The conscious prone position decreased the odds of endotracheal intubation and mortality, especially when patients spent over 8 hours/day in the conscious prone position and treatment in the intensive care unit. However, our results should be cautiously interpreted due to limitations in evaluating randomized clinical trials, nonrandomized clinical trials and observational studies. However, despite systematic reviews with meta-analyses of randomized clinical trials, we must keep in mind that these studies remain heterogeneous from a clinical and methodological point of view.
Views101Abstract
Original ArticleConscious prone positioning in nonintubated COVID-19 patients with acute respiratory distress syndrome: systematic review and meta-analysis
Crit Care Sci. 2024;36:e20240176en
DOI 10.62675/2965-2774.20240176-en
- Gustavo Adolfo Vásquez-Tirado ,
- Edinson Dante Meregildo-Rodríguez ,
- Martha Genara Asmat-Rubio ,
- María José Salazar-Castillo ,
- Claudia Vanessa Quispe-Castañeda ,
- María del Carmen Cuadra-Campos
Views101See moreABSTRACT
Objective:
To systematically review the effect of the prone position on endotracheal intubation and mortality in nonintubated COVID-19 patients with acute respiratory distress syndrome.
Methods:
We registered the protocol (CRD42021286711) and searched for four databases and gray literature from inception to December 31, 2022. We included observational studies and clinical trials. There was no limit by date or the language of publication. We excluded case reports, case series, studies not available in full text, and those studies that included children < 18-years-old.
Results:
We included ten observational studies, eight clinical trials, 3,969 patients, 1,120 endotracheal intubation events, and 843 deaths. All of the studies had a low risk of bias (Newcastle-Ottawa Scale and Risk of Bias 2 tools). We found that the conscious prone position decreased the odds of endotracheal intubation by 44% (OR 0.56; 95%CI 0.40 – 0.78) and mortality by 43% (OR 0.57; 95%CI 0.39 – 0.84) in nonintubated COVID-19 patients with acute respiratory distress syndrome. This protective effect on endotracheal intubation and mortality was more robust in those who spent > 8 hours/day in the conscious prone position (OR 0.43; 95%CI 0.26 – 0.72 and OR 0.38; 95%CI 0.24 – 0.60, respectively). The certainty of the evidence according to the GRADE criteria was moderate.
Conclusion:
The conscious prone position decreased the odds of endotracheal intubation and mortality, especially when patients spent over 8 hours/day in the conscious prone position and treatment in the intensive care unit. However, our results should be cautiously interpreted due to limitations in evaluating randomized clinical trials, nonrandomized clinical trials and observational studies. However, despite systematic reviews with meta-analyses of randomized clinical trials, we must keep in mind that these studies remain heterogeneous from a clinical and methodological point of view.
- Gustavo Adolfo Vásquez-Tirado
-
Letter to the Editor
To: Posterior reversible encephalopathy syndrome in a child with severe multisystem inflammatory syndrome due to COVID-19
Crit Care Sci. 2023;35(4):429-430
Abstract
Letter to the EditorTo: Posterior reversible encephalopathy syndrome in a child with severe multisystem inflammatory syndrome due to COVID-19
Crit Care Sci. 2023;35(4):429-430
DOI 10.5935/2965-2774.20230322-pt
Views52To the editorWe eagerly read the article by Dominguez-Rojas et al. about a 9-year-old male with a 3-day history of a gastrointestinal infection who underwent explorative abdominal surgery for acute abdomen, which was noninformative.() Postoperatively, the patient developed pneumonia requiring mechanical ventilation.() After extubation, the patient was diagnosed with multisystem inflammatory syndrome in children (MIS-C) […]See moreViews52Abstract
Letter to the EditorTo: Posterior reversible encephalopathy syndrome in a child with severe multisystem inflammatory syndrome due to COVID-19
Crit Care Sci. 2023;35(4):429-430
DOI 10.5935/2965-2774.20230322-pt
Views52To the editorWe eagerly read the article by Dominguez-Rojas et al. about a 9-year-old male with a 3-day history of a gastrointestinal infection who underwent explorative abdominal surgery for acute abdomen, which was noninformative.() Postoperatively, the patient developed pneumonia requiring mechanical ventilation.() After extubation, the patient was diagnosed with multisystem inflammatory syndrome in children (MIS-C) […]See more -
Special Article
Use of bedside echocardiography in the care of critically ill patients – a joint consensus document of the Associação de Medicina Intensiva Brasileira, Associação Brasileira de Medicina de Emergência, and Sociedade Brasileira de Medicina Hospitalar. Part 1 – Competence in bedside echocardiography
- José Augusto Santos Pellegrini ,
- Ciro Leite Mendes ,
- Paulo César Gottardo ,
- Khalil Feitosa,
- Josiane França John , [ … ],
- Ricardo Luiz Cordioli
Abstract
Special ArticleUse of bedside echocardiography in the care of critically ill patients – a joint consensus document of the Associação de Medicina Intensiva Brasileira, Associação Brasileira de Medicina de Emergência, and Sociedade Brasileira de Medicina Hospitalar. Part 1 – Competence in bedside echocardiography
Crit Care Sci. 2023;35(1):2-10
DOI 10.5935/2965-2774.20230307-pt
- José Augusto Santos Pellegrini ,
- Ciro Leite Mendes ,
- Paulo César Gottardo ,
- Khalil Feitosa,
- Josiane França John ,
- Ana Cláudia Tonelli de Oliveira ,
- Alexandre Jorge de Andrade Negri,
- Ana Burigo Grumann ,
- Dalton de Souza Barros,
- Fátima Elizabeth Fonseca de Oliveira Negri,
- Gérson Luiz de Macedo ,
- Júlio Leal Bandeira Neves,
- Márcio da Silveira Rodrigues,
- Marcio Fernando Spagnól ,
- Marcus Antonio Ferez,
- Ricardo Ávila Chalhub ,
- Ricardo Luiz Cordioli
Views37See moreABSTRACT
The use of echocardiography by physicians who are not echocardiographers has become common throughout the world across highly diverse settings where the care of acutely ill patients is provided. Echocardiographic evaluation performed in a point-of-care manner can provide relevant information regarding the mechanism of causes of shock, for example, increasing the rates of correct diagnosis and allowing for faster informed decision-making than through evaluation methods. Considering that the accurate diagnosis of life-threatening situations is essential for professionals working with acutely ill patients, several international associations recommend that physicians responsible for critically ill patients acquire and develop the ability to perform bedside ultrasound examinations, including echocardiographic examinations. However, there is no consensus in the literature regarding which specific applications should be included in the list of skills for nonechocardiographer physicians. Taking into account the multiplicity of applications of echocardiography in different scenarios related to acutely ill patients; the differences in the published protocols, with regard to both the teaching methodology and competence verification; and the heterogeneity of training among highly diverse specialties responsible for their care at different levels, this consensus document aimed to reflect the position of representatives of related Brazilian medical societies on the subject and may thus serve as a starting point both for standardization among different specialties and for the transmission of knowledge and verification of the corresponding competencies.
Views37Abstract
Special ArticleUse of bedside echocardiography in the care of critically ill patients – a joint consensus document of the Associação de Medicina Intensiva Brasileira, Associação Brasileira de Medicina de Emergência, and Sociedade Brasileira de Medicina Hospitalar. Part 1 – Competence in bedside echocardiography
Crit Care Sci. 2023;35(1):2-10
DOI 10.5935/2965-2774.20230307-pt
- José Augusto Santos Pellegrini ,
- Ciro Leite Mendes ,
- Paulo César Gottardo ,
- Khalil Feitosa,
- Josiane França John ,
- Ana Cláudia Tonelli de Oliveira ,
- Alexandre Jorge de Andrade Negri,
- Ana Burigo Grumann ,
- Dalton de Souza Barros,
- Fátima Elizabeth Fonseca de Oliveira Negri,
- Gérson Luiz de Macedo ,
- Júlio Leal Bandeira Neves,
- Márcio da Silveira Rodrigues,
- Marcio Fernando Spagnól ,
- Marcus Antonio Ferez,
- Ricardo Ávila Chalhub ,
- Ricardo Luiz Cordioli
Views37See moreABSTRACT
The use of echocardiography by physicians who are not echocardiographers has become common throughout the world across highly diverse settings where the care of acutely ill patients is provided. Echocardiographic evaluation performed in a point-of-care manner can provide relevant information regarding the mechanism of causes of shock, for example, increasing the rates of correct diagnosis and allowing for faster informed decision-making than through evaluation methods. Considering that the accurate diagnosis of life-threatening situations is essential for professionals working with acutely ill patients, several international associations recommend that physicians responsible for critically ill patients acquire and develop the ability to perform bedside ultrasound examinations, including echocardiographic examinations. However, there is no consensus in the literature regarding which specific applications should be included in the list of skills for nonechocardiographer physicians. Taking into account the multiplicity of applications of echocardiography in different scenarios related to acutely ill patients; the differences in the published protocols, with regard to both the teaching methodology and competence verification; and the heterogeneity of training among highly diverse specialties responsible for their care at different levels, this consensus document aimed to reflect the position of representatives of related Brazilian medical societies on the subject and may thus serve as a starting point both for standardization among different specialties and for the transmission of knowledge and verification of the corresponding competencies.
- José Augusto Santos Pellegrini
-
Editorial
Open-access publications: a double-edged sword for critical care researchers in lowand middle-income countries
Crit Care Sci. 2023;35(4):342-344
Abstract
EditorialOpen-access publications: a double-edged sword for critical care researchers in lowand middle-income countries
Crit Care Sci. 2023;35(4):342-344
DOI 10.5935/2965-2774.20230263-pt
Views36Open access model and lowand middle-income countries Open access journals usually exempt researchers from low-income countries from publication fees, and this exemption seems to favor the publication of articles by researchers from sub-Saharan Africa.() However, producing high-quality scientific research in these settings is challenging and often funded by agencies such as the National Institutes of […]See moreViews36Abstract
EditorialOpen-access publications: a double-edged sword for critical care researchers in lowand middle-income countries
Crit Care Sci. 2023;35(4):342-344
DOI 10.5935/2965-2774.20230263-pt
Views36Open access model and lowand middle-income countries Open access journals usually exempt researchers from low-income countries from publication fees, and this exemption seems to favor the publication of articles by researchers from sub-Saharan Africa.() However, producing high-quality scientific research in these settings is challenging and often funded by agencies such as the National Institutes of […]See more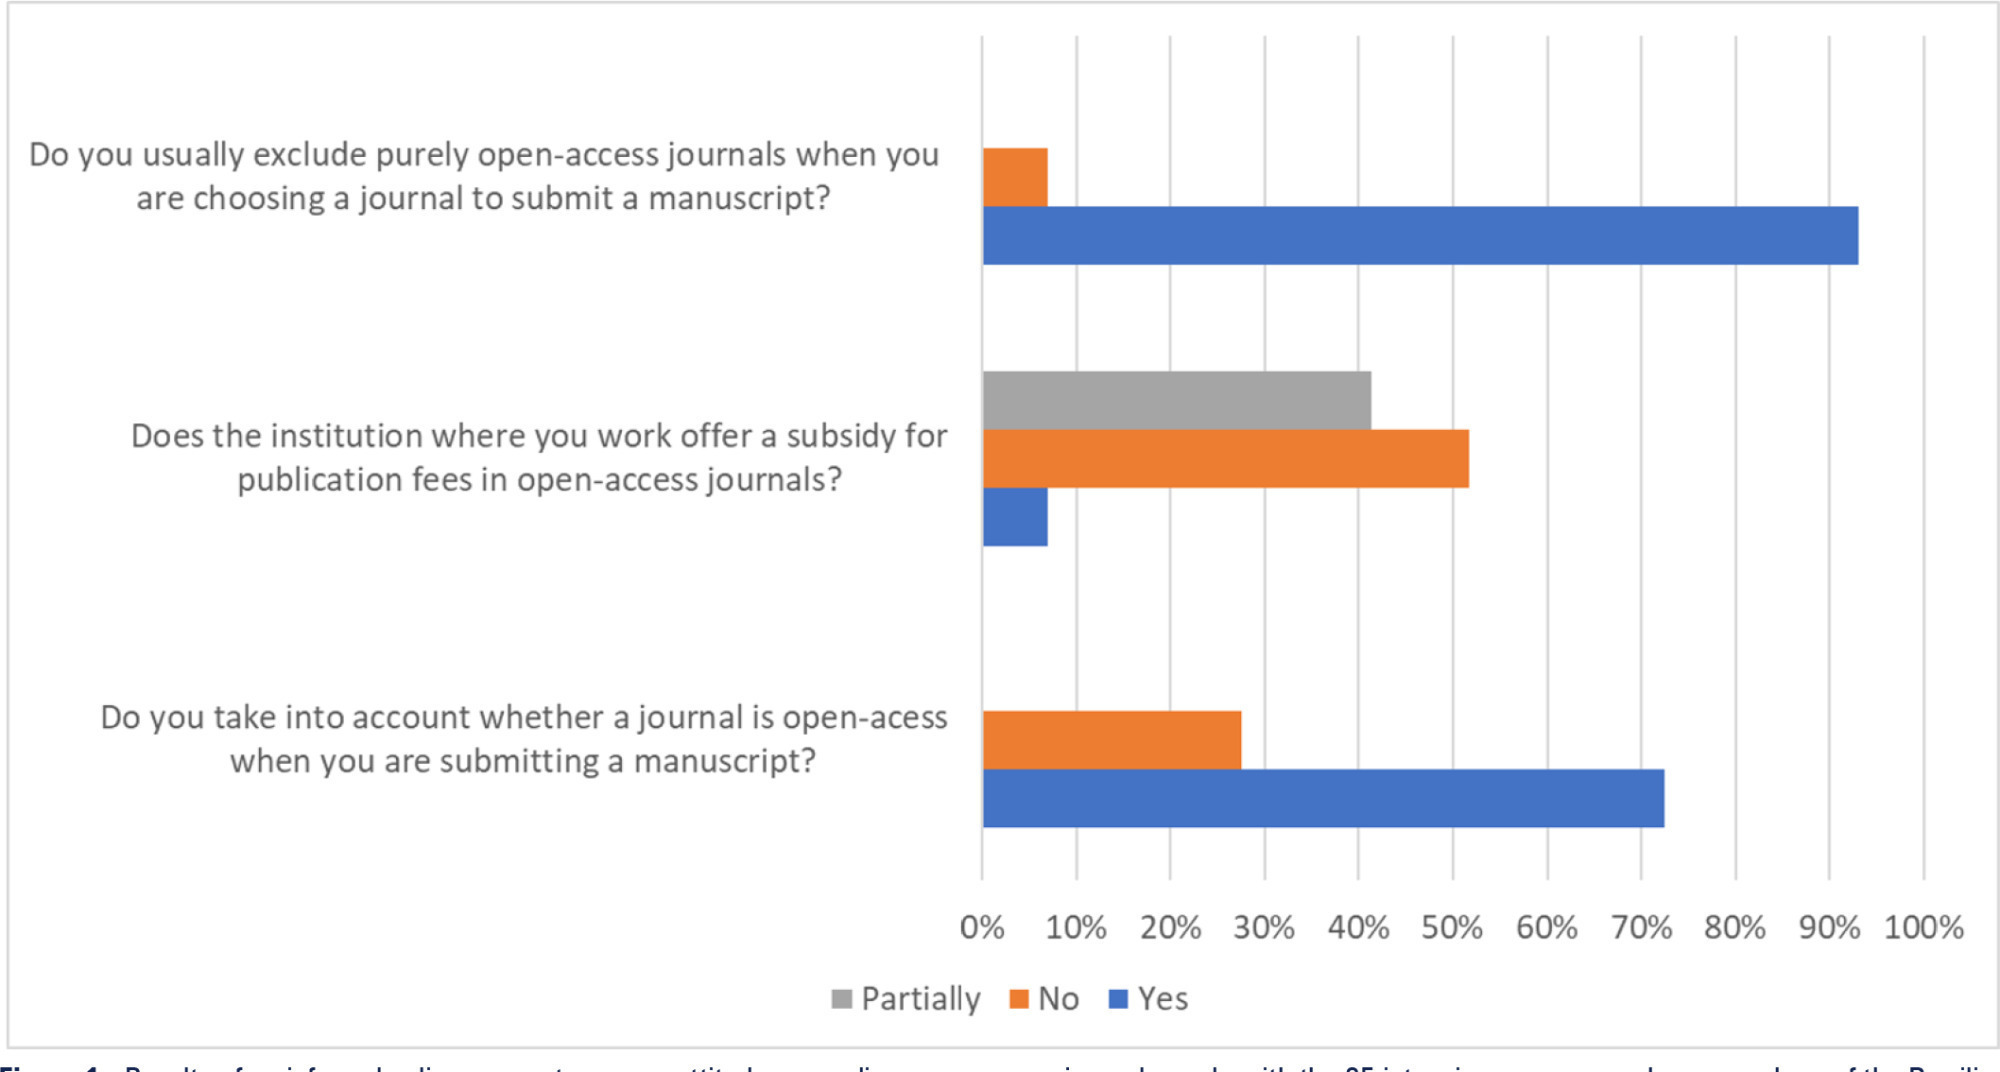
-
Letter to the Editor
In-hospital extracorporeal cardiopulmonary resuscitation: preliminary results in a second-level hospital
- Raimundo García-del Moral Martín ,
- Manuel Muñoz Garach ,
- Maria Eugenia Poyatos-Aguilera ,
- Teresa Gil-Jiménez ,
- Juan Caballero Borrego , [ … ],
- Manuel Colmenero
Abstract
Letter to the EditorIn-hospital extracorporeal cardiopulmonary resuscitation: preliminary results in a second-level hospital
Crit Care Sci. 2023;35(4):423-426
DOI 10.5935/2965-2774.20230161-pt
- Raimundo García-del Moral Martín ,
- Manuel Muñoz Garach ,
- Maria Eugenia Poyatos-Aguilera ,
- Teresa Gil-Jiménez ,
- Juan Caballero Borrego ,
- Manuel Colmenero
Views35INTRODUCTIONCardiac arrest (CA) is a major health problem associated with serious personal and social consequences. In Spain, 50,000 CA cases are estimated to occur per year, half of which are expected to occur in health care facilities.() The shortand long-term prognoses of these patients are associated with the early initiation of basic and advanced life […]See moreViews35Abstract
Letter to the EditorIn-hospital extracorporeal cardiopulmonary resuscitation: preliminary results in a second-level hospital
Crit Care Sci. 2023;35(4):423-426
DOI 10.5935/2965-2774.20230161-pt
- Raimundo García-del Moral Martín ,
- Manuel Muñoz Garach ,
- Maria Eugenia Poyatos-Aguilera ,
- Teresa Gil-Jiménez ,
- Juan Caballero Borrego ,
- Manuel Colmenero
Views35INTRODUCTIONCardiac arrest (CA) is a major health problem associated with serious personal and social consequences. In Spain, 50,000 CA cases are estimated to occur per year, half of which are expected to occur in health care facilities.() The shortand long-term prognoses of these patients are associated with the early initiation of basic and advanced life […]See more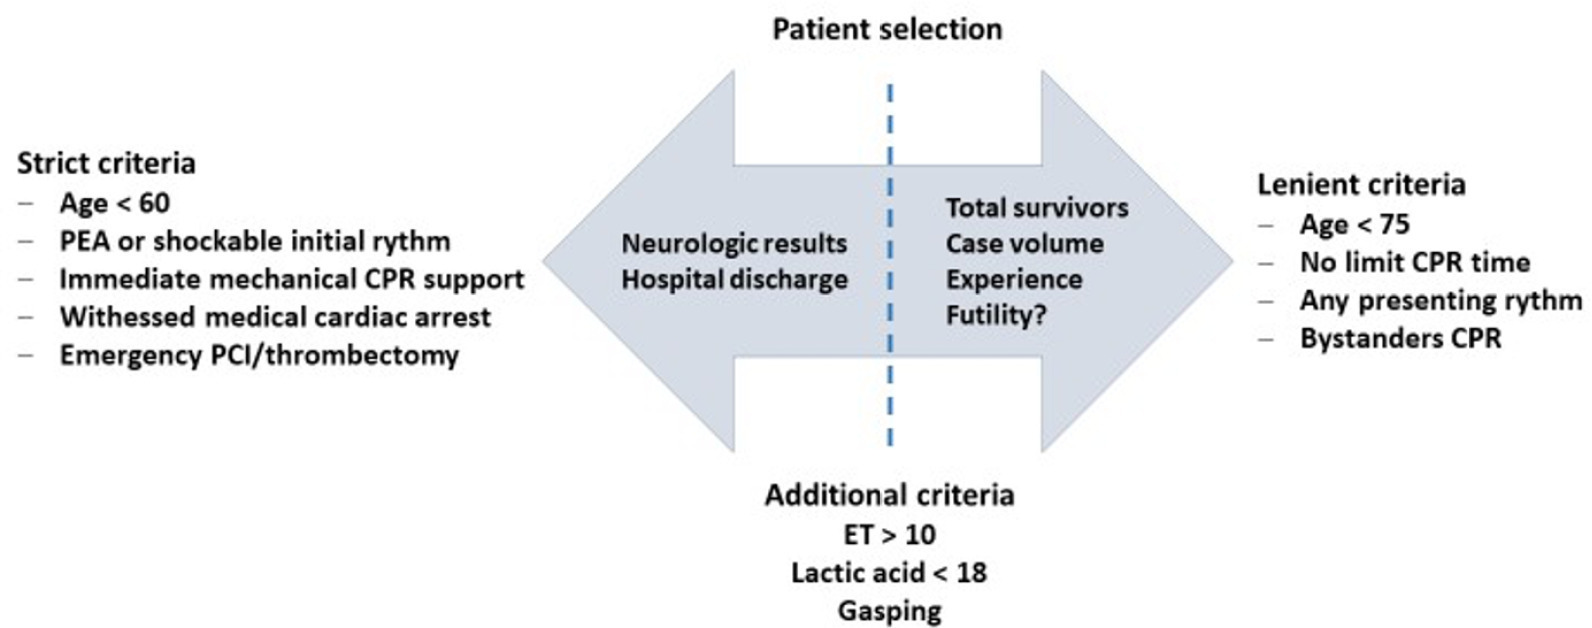
- Raimundo García-del Moral Martín
-
Author’s Response
Reply to: Critical COVID-19 and neurological dysfunction – a direct comparative analysis between SARS-CoV-2 and other infectious pathogens
Crit Care Sci. 2023;35(3):337-337
Abstract
Author’s ResponseReply to: Critical COVID-19 and neurological dysfunction – a direct comparative analysis between SARS-CoV-2 and other infectious pathogens
Crit Care Sci. 2023;35(3):337-337
DOI 10.5935/2965-2774.20230383resp-pt
Views28TO THE EDITORThe authors thank Dr. Magoon and Dr. Suresh for the letter and for their interest in our study “Critical COVID-19 and neurological dysfunction – a direct comparative analysis between SARS-CoV-2 and other infectious pathogens”.()We start by highlighting the importance and pertinence of the first comment in the letter. Indeed, in our analysis, COVID-19 […]See moreViews28Abstract
Author’s ResponseReply to: Critical COVID-19 and neurological dysfunction – a direct comparative analysis between SARS-CoV-2 and other infectious pathogens
Crit Care Sci. 2023;35(3):337-337
DOI 10.5935/2965-2774.20230383resp-pt
Views28TO THE EDITORThe authors thank Dr. Magoon and Dr. Suresh for the letter and for their interest in our study “Critical COVID-19 and neurological dysfunction – a direct comparative analysis between SARS-CoV-2 and other infectious pathogens”.()We start by highlighting the importance and pertinence of the first comment in the letter. Indeed, in our analysis, COVID-19 […]See more -
Original Article
Intensivist-led ultrasound-guided percutaneous tracheostomy: a phase IV cohort study
- Pedro Fortes Osório Bustamante ,
- Bruno Adler Maccagnan Pinheiro Besen ,
- Amanda Pinto Botêga ,
- Filipe Matheus Cadamuro ,
- Marcelo Park , [ … ],
- Roberta Muriel Longo Roepke
Abstract
Original ArticleIntensivist-led ultrasound-guided percutaneous tracheostomy: a phase IV cohort study
Crit Care Sci. 2023;35(4):402-410
DOI 10.5935/2965-2774.20230174-pt
- Pedro Fortes Osório Bustamante ,
- Bruno Adler Maccagnan Pinheiro Besen ,
- Amanda Pinto Botêga ,
- Filipe Matheus Cadamuro ,
- Marcelo Park ,
- Pedro Vitale Mendes ,
- Roberta Muriel Longo Roepke
Views24See moreABSTRACT
Objective:
To describe, with a larger number of patients in a real-world scenario following routine implementation, intensivist-led ultrasound-guided percutaneous dilational tracheostomy and the possible risks and complications of the procedure not identified in clinical trials.
Methods:
This was a phase IV cohort study of patients admitted to three intensive care units of a quaternary academic hospital who underwent intensivist-led ultrasound-guided percutaneous tracheostomy in Brazil from September 2017 to December 2021.
Results:
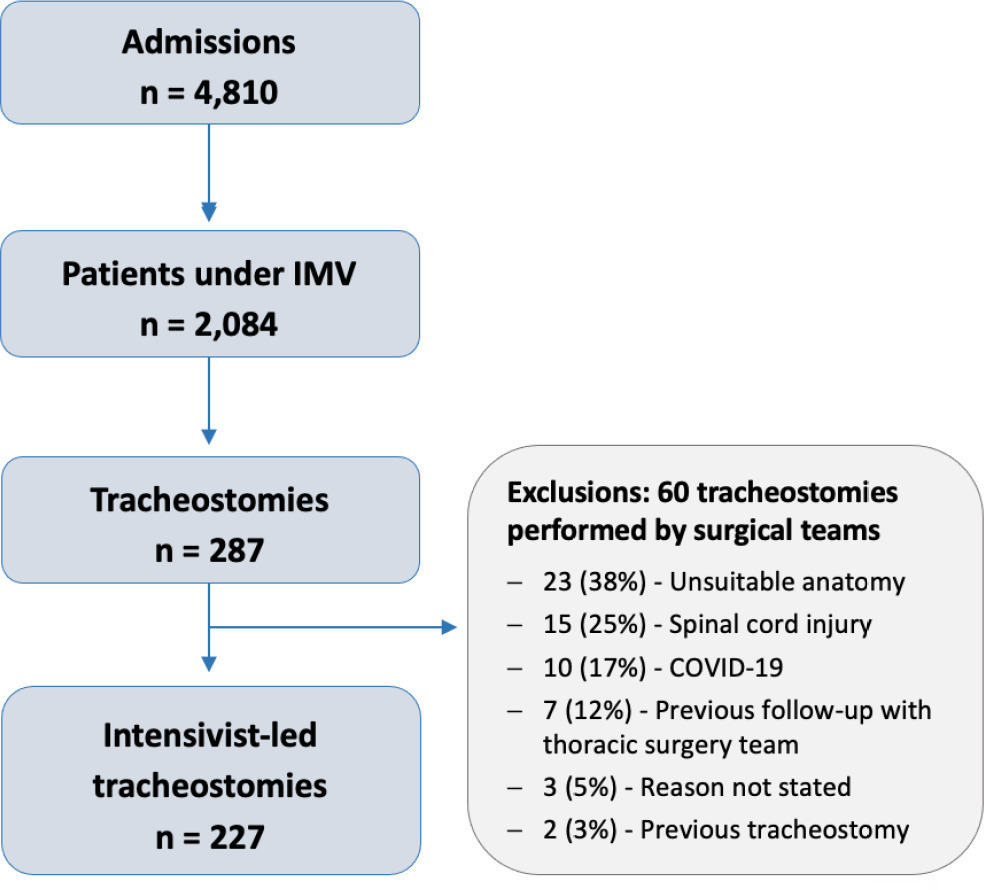
There were 4,810 intensive care unit admissions during the study period; 2,084 patients received mechanical ventilation, and 287 underwent tracheostomy, 227 of which were performed at bedside by the intensive care team. The main reason for intensive care unit admission was trauma, and for perform a tracheostomy it was a neurological impairment or an inability to protect the airways. The median time from intubation to tracheostomy was 14 days. Intensive care residents performed 76% of the procedures. At least one complication occurred in 29.5% of the procedures, the most common being hemodynamic instability and extubation during the procedure, with only 3 serious complications. The intensive care unit mortality was 29.1%, and the hospital mortality was 43.6%.
Conclusion:
Intensivist-led ultrasound-guided percutaneous tracheostomy is feasible out of a clinical trial context with outcomes and complications comparable to those in the literature. Intensivists can acquire this competence during their training but should be aware of potential complications to enhance procedural safety.
Views24Abstract
Original ArticleIntensivist-led ultrasound-guided percutaneous tracheostomy: a phase IV cohort study
Crit Care Sci. 2023;35(4):402-410
DOI 10.5935/2965-2774.20230174-pt
- Pedro Fortes Osório Bustamante ,
- Bruno Adler Maccagnan Pinheiro Besen ,
- Amanda Pinto Botêga ,
- Filipe Matheus Cadamuro ,
- Marcelo Park ,
- Pedro Vitale Mendes ,
- Roberta Muriel Longo Roepke
Views24See moreABSTRACT
Objective:
To describe, with a larger number of patients in a real-world scenario following routine implementation, intensivist-led ultrasound-guided percutaneous dilational tracheostomy and the possible risks and complications of the procedure not identified in clinical trials.
Methods:
This was a phase IV cohort study of patients admitted to three intensive care units of a quaternary academic hospital who underwent intensivist-led ultrasound-guided percutaneous tracheostomy in Brazil from September 2017 to December 2021.
Results:
There were 4,810 intensive care unit admissions during the study period; 2,084 patients received mechanical ventilation, and 287 underwent tracheostomy, 227 of which were performed at bedside by the intensive care team. The main reason for intensive care unit admission was trauma, and for perform a tracheostomy it was a neurological impairment or an inability to protect the airways. The median time from intubation to tracheostomy was 14 days. Intensive care residents performed 76% of the procedures. At least one complication occurred in 29.5% of the procedures, the most common being hemodynamic instability and extubation during the procedure, with only 3 serious complications. The intensive care unit mortality was 29.1%, and the hospital mortality was 43.6%.
Conclusion:
Intensivist-led ultrasound-guided percutaneous tracheostomy is feasible out of a clinical trial context with outcomes and complications comparable to those in the literature. Intensivists can acquire this competence during their training but should be aware of potential complications to enhance procedural safety.
- Pedro Fortes Osório Bustamante
-
Original Articles
The Epimed Monitor ICU Database®: a cloud-based national registry for adult intensive care unit patients in Brazil
Rev Bras Ter Intensiva. 2017;29(4):418-426
Abstract
Original ArticlesThe Epimed Monitor ICU Database®: a cloud-based national registry for adult intensive care unit patients in Brazil
Rev Bras Ter Intensiva. 2017;29(4):418-426
DOI 10.5935/0103-507X.20170062
Views6See moreABSTRACT
Objective:
To describe the Epimed Monitor Database®, a Brazilian intensive care unit quality improvement database.
Methods:
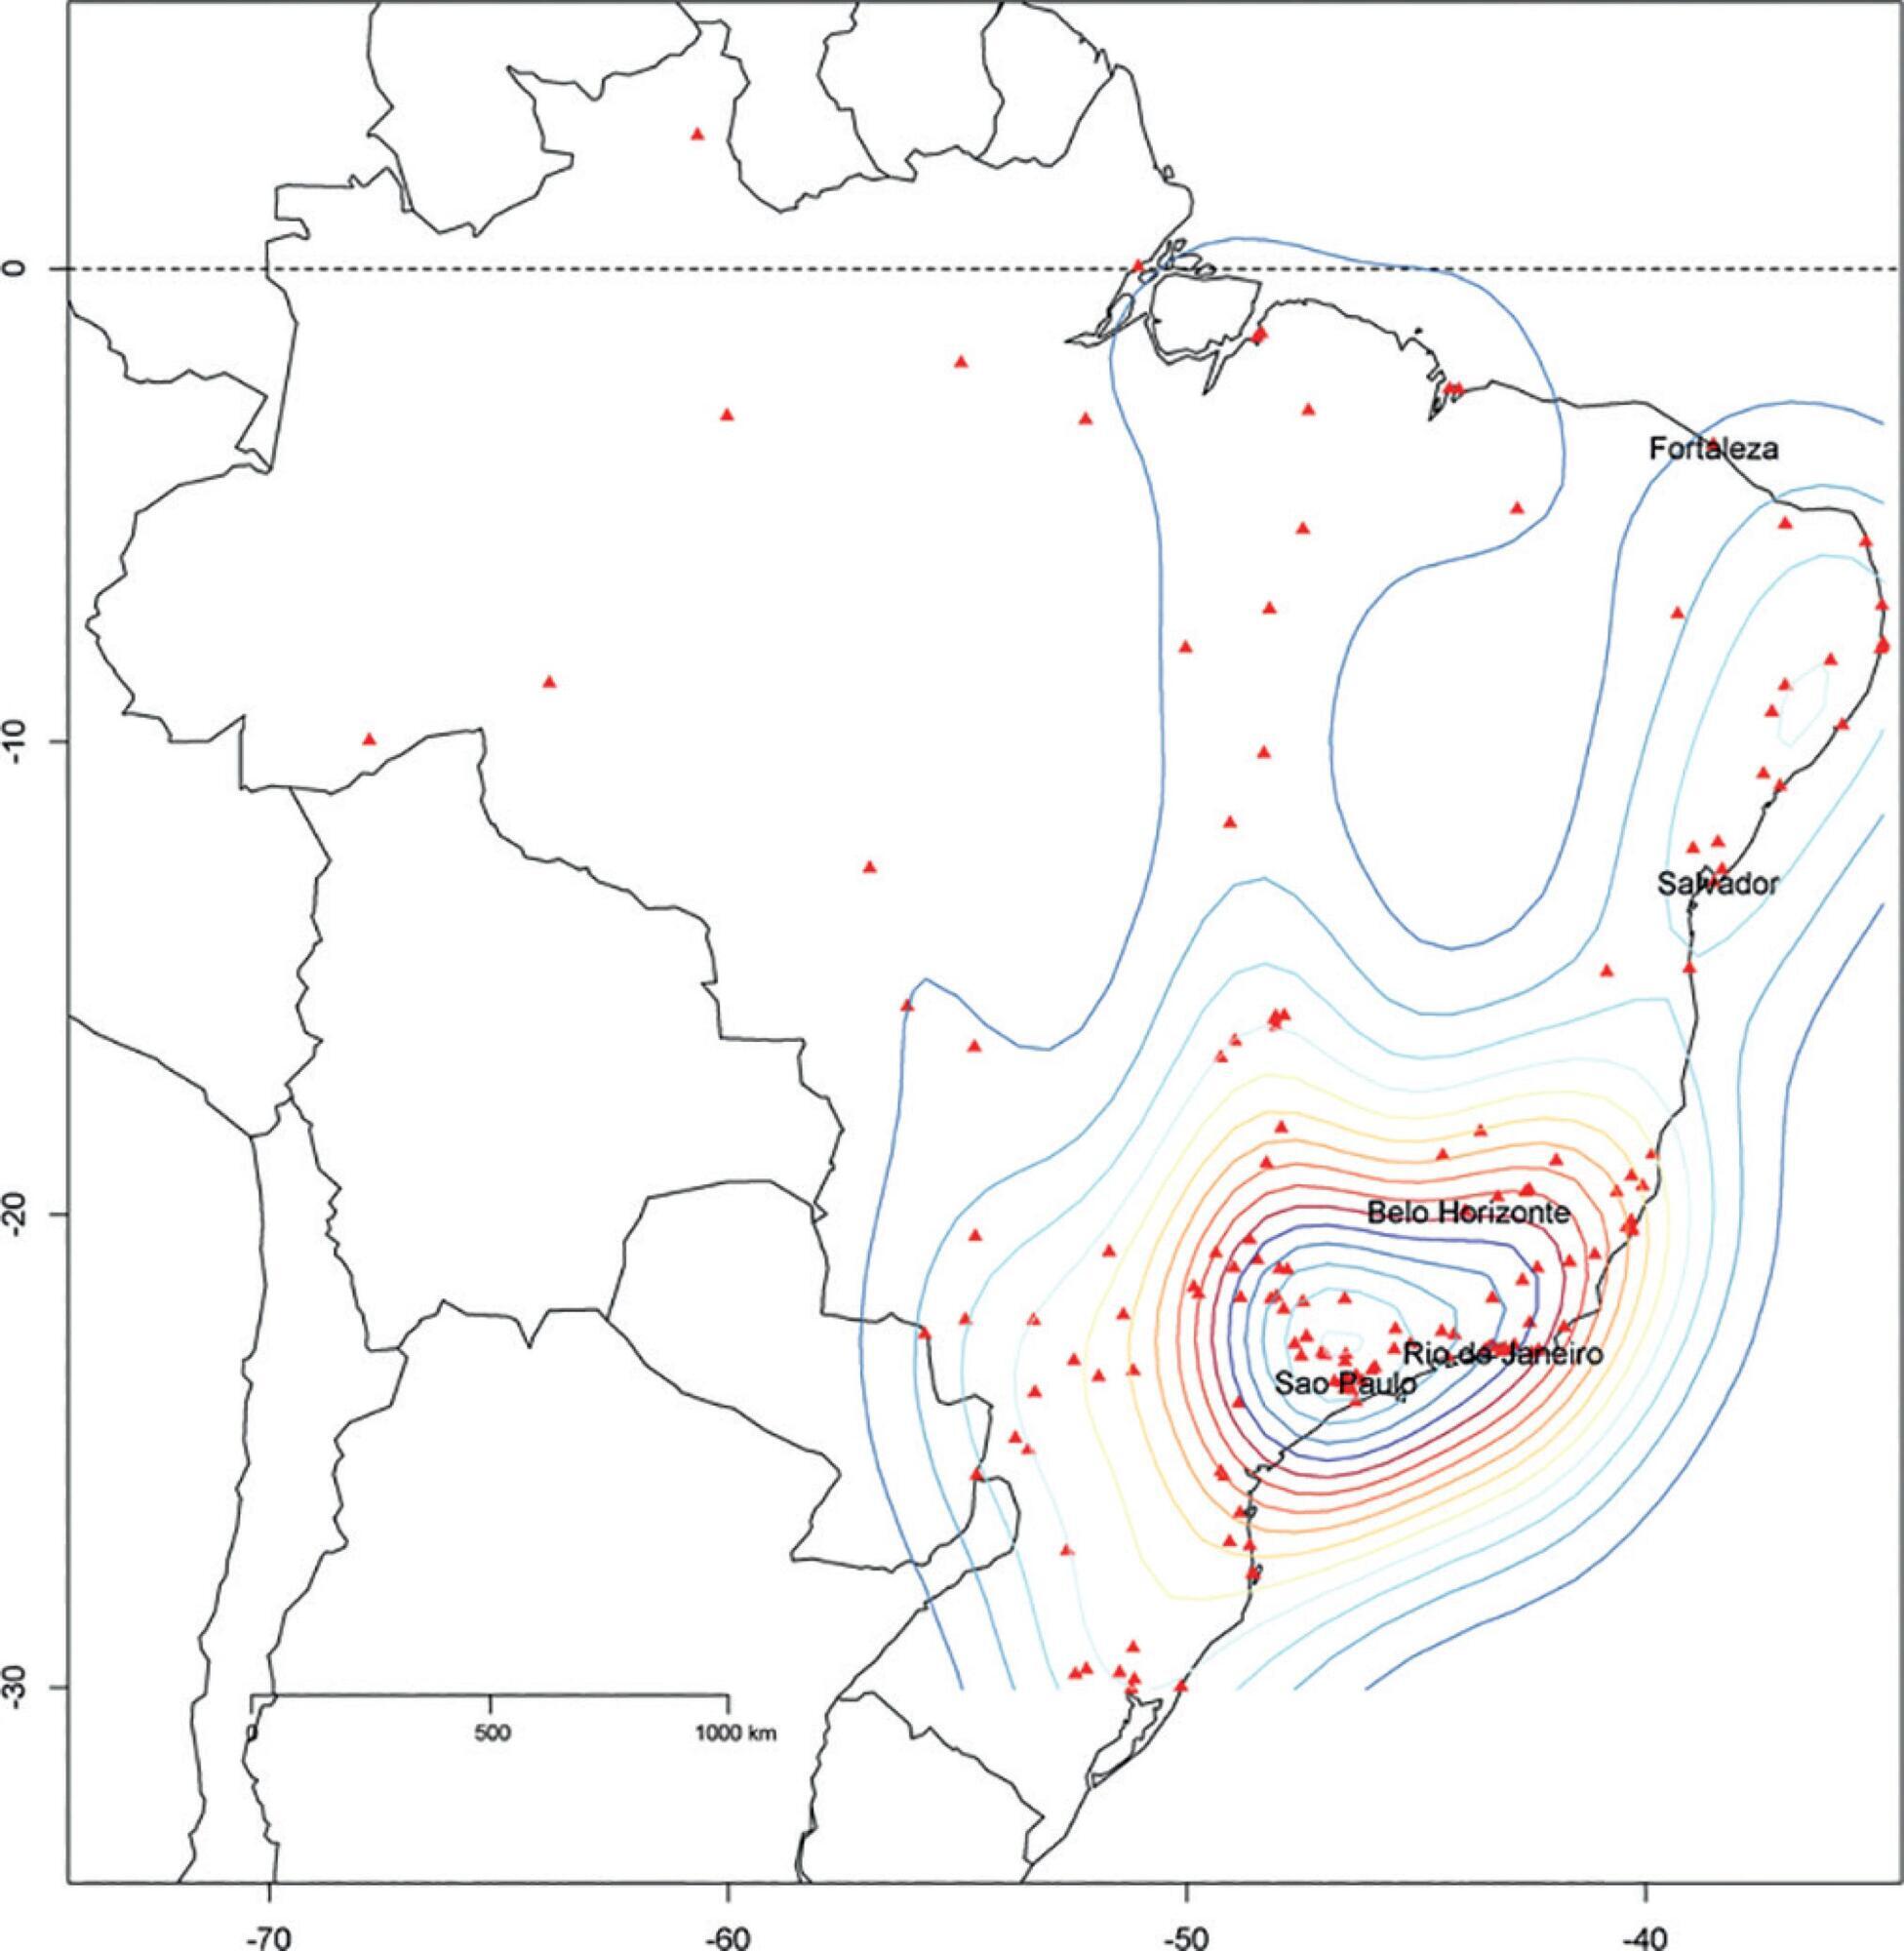
We described the Epimed Monitor® Database, including its structure and core data. We presented aggregated informative data from intensive care unit admissions from 2010 to 2016 using descriptive statistics. We also described the expansion and growth of the database along with the geographical distribution of participating units in Brazil.
Results:
The core data from the database includes demographic, administrative and physiological parameters, as well as specific report forms used to gather detailed data regarding the use of intensive care unit resources, infectious episodes, adverse events and checklists for adherence to best clinical practices. As of the end of 2016, 598 adult intensive care units in 318 hospitals totaling 8,160 intensive care unit beds were participating in the database. Most units were located at private hospitals in the southeastern region of the country. The number of yearly admissions rose during this period and included a predominance of medical admissions. The proportion of admissions due to cardiovascular disease declined, while admissions due to sepsis or infections became more common. Illness severity (Simplified Acute Physiology Score – SAPS 3 – 62 points), patient age (mean = 62 years) and hospital mortality (approximately 17%) remained reasonably stable during this time period.
Conclusion:
A large private database of critically ill patients is feasible and may provide relevant nationwide epidemiological data for quality improvement and benchmarking purposes among the participating intensive care units. This database is useful not only for administrative reasons but also for the improvement of daily care by facilitating the adoption of best practices and use for clinical research.
Views6Abstract
Original ArticlesThe Epimed Monitor ICU Database®: a cloud-based national registry for adult intensive care unit patients in Brazil
Rev Bras Ter Intensiva. 2017;29(4):418-426
DOI 10.5935/0103-507X.20170062
Views6See moreABSTRACT
Objective:
To describe the Epimed Monitor Database®, a Brazilian intensive care unit quality improvement database.
Methods:
We described the Epimed Monitor® Database, including its structure and core data. We presented aggregated informative data from intensive care unit admissions from 2010 to 2016 using descriptive statistics. We also described the expansion and growth of the database along with the geographical distribution of participating units in Brazil.
Results:
The core data from the database includes demographic, administrative and physiological parameters, as well as specific report forms used to gather detailed data regarding the use of intensive care unit resources, infectious episodes, adverse events and checklists for adherence to best clinical practices. As of the end of 2016, 598 adult intensive care units in 318 hospitals totaling 8,160 intensive care unit beds were participating in the database. Most units were located at private hospitals in the southeastern region of the country. The number of yearly admissions rose during this period and included a predominance of medical admissions. The proportion of admissions due to cardiovascular disease declined, while admissions due to sepsis or infections became more common. Illness severity (Simplified Acute Physiology Score – SAPS 3 – 62 points), patient age (mean = 62 years) and hospital mortality (approximately 17%) remained reasonably stable during this time period.
Conclusion:
A large private database of critically ill patients is feasible and may provide relevant nationwide epidemiological data for quality improvement and benchmarking purposes among the participating intensive care units. This database is useful not only for administrative reasons but also for the improvement of daily care by facilitating the adoption of best practices and use for clinical research.
-
Original Articles – Clinical Research
Influence of early mobilization on respiratory and peripheral muscle strength in critically ill patients
Rev Bras Ter Intensiva. 2012;24(2):173-178
Abstract
Original Articles – Clinical ResearchInfluence of early mobilization on respiratory and peripheral muscle strength in critically ill patients
Rev Bras Ter Intensiva. 2012;24(2):173-178
DOI 10.1590/S0103-507X2012000200013
Views7See moreOBJECTIVE:To evaluate the effects of an early mobilization protocol on respiratory and peripheral muscles in critically ill patients. METHODS: A randomized controlled clinical trial was conducted with 59 male and female patients on mechanical ventilation. The patients were divided into a conventional physical therapy group (control group, n=14) that received the sector’s standard physical therapy program and an early mobilization group (n=14) that received a systematic early mobilization protocol. Peripheral muscle strength was assessed with the Medical Research Council score, and respiratory muscle strength (determined by the maximal inspiratory and expiratory pressures) was measured using a vacuum manometer with a unidirectional valve. Systematic early mobilization was performed on five levels. RESULTS: Significant increases were observed for values for maximal inspiratory pressure and the Medical Research Council score in the early mobilization group. However, no statistically significant improvement was observed for maximal expiratory pressure or MV duration (days), length of stay in the intensive care unit (days), and length of hospital stay (days). CONCLUSION: The early mobilization group showed gains in inspiratory and peripheral muscle strength.
Views7Abstract
Original Articles – Clinical ResearchInfluence of early mobilization on respiratory and peripheral muscle strength in critically ill patients
Rev Bras Ter Intensiva. 2012;24(2):173-178
DOI 10.1590/S0103-507X2012000200013
Views7See moreOBJECTIVE:To evaluate the effects of an early mobilization protocol on respiratory and peripheral muscles in critically ill patients. METHODS: A randomized controlled clinical trial was conducted with 59 male and female patients on mechanical ventilation. The patients were divided into a conventional physical therapy group (control group, n=14) that received the sector’s standard physical therapy program and an early mobilization group (n=14) that received a systematic early mobilization protocol. Peripheral muscle strength was assessed with the Medical Research Council score, and respiratory muscle strength (determined by the maximal inspiratory and expiratory pressures) was measured using a vacuum manometer with a unidirectional valve. Systematic early mobilization was performed on five levels. RESULTS: Significant increases were observed for values for maximal inspiratory pressure and the Medical Research Council score in the early mobilization group. However, no statistically significant improvement was observed for maximal expiratory pressure or MV duration (days), length of stay in the intensive care unit (days), and length of hospital stay (days). CONCLUSION: The early mobilization group showed gains in inspiratory and peripheral muscle strength.
-
Special Articles
Physical therapy in critically ill adult patients: recommendations from the Brazilian Association of Intensive Care Medicine Department of Physical Therapy
Rev Bras Ter Intensiva. 2012;24(1):6-22
Abstract
Special ArticlesPhysical therapy in critically ill adult patients: recommendations from the Brazilian Association of Intensive Care Medicine Department of Physical Therapy
Rev Bras Ter Intensiva. 2012;24(1):6-22
DOI 10.1590/S0103-507X2012000100003
Views5See moreComplications from immobility in intensive care unit patients contribute to functional decline, increased healthcare costs, reduced quality of life and higher post-discharge mortality. Physical therapy focuses on promoting recovery and preserving function, and it may minimize the impact of these complications. A group of Brazilian Association of Intensive Care Medicine physical therapy experts developed this document that contains minimal physical therapy recommendations appropriate to the Brazilian real-world clinical situation. Prevention and treatment of atelectasis, procedures related to the removal of secretions and treatment of conditions related to physical deconditioning and functional decline are discussed. Equally important is the consideration that prescribing and executing activities, mobilizations and exercises are roles of the physical therapist, whose diagnosis should precede any intervention.
Views5Abstract
Special ArticlesPhysical therapy in critically ill adult patients: recommendations from the Brazilian Association of Intensive Care Medicine Department of Physical Therapy
Rev Bras Ter Intensiva. 2012;24(1):6-22
DOI 10.1590/S0103-507X2012000100003
Views5See moreComplications from immobility in intensive care unit patients contribute to functional decline, increased healthcare costs, reduced quality of life and higher post-discharge mortality. Physical therapy focuses on promoting recovery and preserving function, and it may minimize the impact of these complications. A group of Brazilian Association of Intensive Care Medicine physical therapy experts developed this document that contains minimal physical therapy recommendations appropriate to the Brazilian real-world clinical situation. Prevention and treatment of atelectasis, procedures related to the removal of secretions and treatment of conditions related to physical deconditioning and functional decline are discussed. Equally important is the consideration that prescribing and executing activities, mobilizations and exercises are roles of the physical therapist, whose diagnosis should precede any intervention.
-
Original Articles
The reality of patients requiring prolonged mechanical ventilation: a multicenter study
Rev Bras Ter Intensiva. 2015;27(1):26-35
Abstract
Original ArticlesThe reality of patients requiring prolonged mechanical ventilation: a multicenter study
Rev Bras Ter Intensiva. 2015;27(1):26-35
DOI 10.5935/0103-507X.20150006
Views3See moreObjective:
The number of patients who require prolonged mechanical ventilation increased during the last decade, which generated a large population of chronically ill patients. This study established the incidence of prolonged mechanical ventilation in four intensive care units and reported different characteristics, hospital outcomes, and the impact of costs and services of prolonged mechanical ventilation patients (mechanical ventilation dependency ≥ 21 days) compared with non-prolonged mechanical ventilation patients (mechanical ventilation dependency < 21 days).
Methods:
This study was a multicenter cohort study of all patients who were admitted to four intensive care units. The main outcome measures were length of stay in the intensive care unit, hospital, complications during intensive care unit stay, and intensive care unit and hospital mortality.
Results:
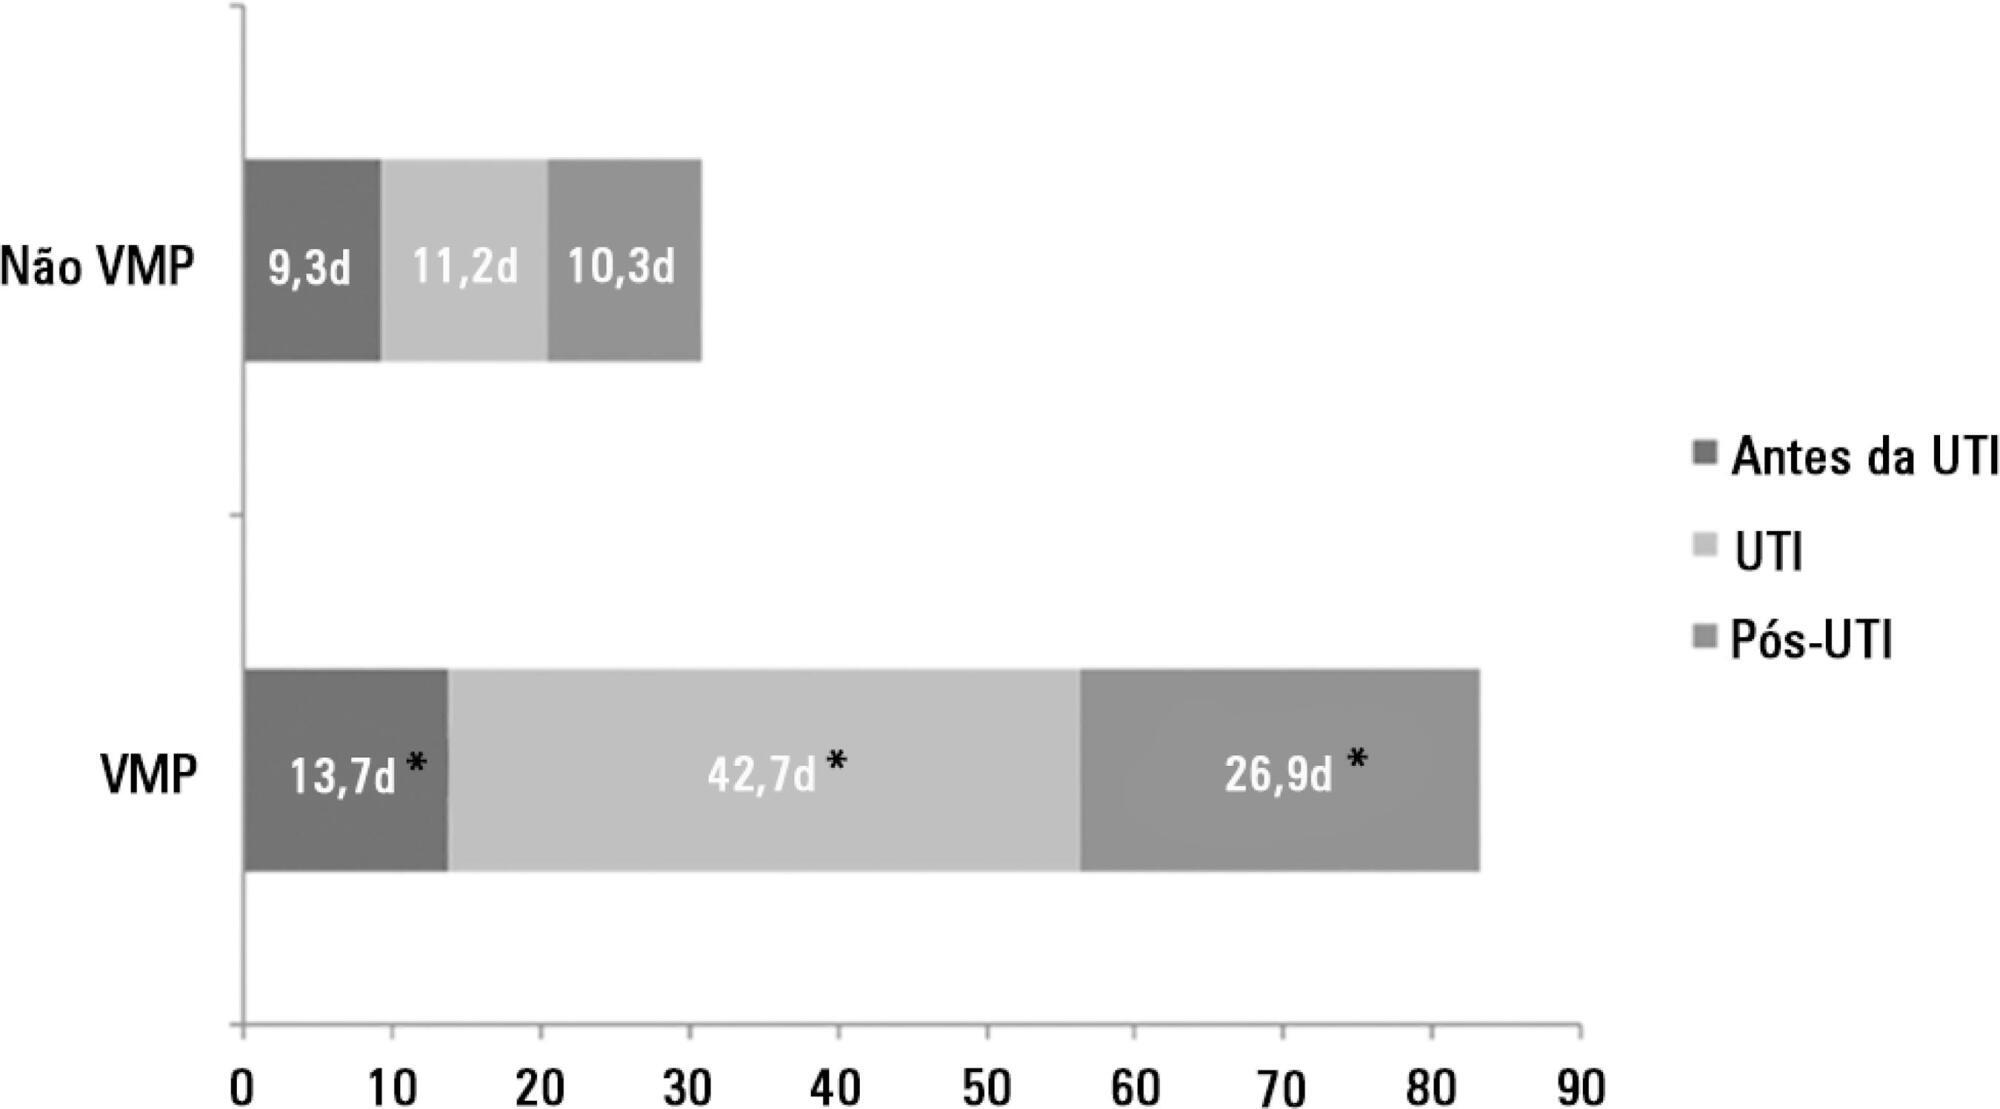
There were 5,287 admissions to the intensive care units during study period. Some of these patients (41.5%) needed ventilatory support (n = 2,197), and 218 of the patients met criteria for prolonged mechanical ventilation (9.9%). Some complications developed during intensive care unit stay, such as muscle weakness, pressure ulcers, bacterial nosocomial sepsis, candidemia, pulmonary embolism, and hyperactive delirium, were associated with a significantly higher risk of prolonged mechanical ventilation. Prolonged mechanical ventilation patients had a significant increase in intensive care unit mortality (absolute difference = 14.2%, p < 0.001) and hospital mortality (absolute difference = 19.1%, p < 0.001). The prolonged mechanical ventilation group spent more days in the hospital after intensive care unit discharge (26.9 ± 29.3 versus 10.3 ± 20.4 days, p < 0.001) with higher costs.
Conclusion:
The classification of chronically critically ill patients according to the definition of prolonged mechanical ventilation adopted by our study (mechanical ventilation dependency ≥ 21 days) identified patients with a high risk for complications during intensive care unit stay, longer intensive care unit and hospital stays, high death rates, and higher costs.
Views3Abstract
Original ArticlesThe reality of patients requiring prolonged mechanical ventilation: a multicenter study
Rev Bras Ter Intensiva. 2015;27(1):26-35
DOI 10.5935/0103-507X.20150006
Views3See moreObjective:
The number of patients who require prolonged mechanical ventilation increased during the last decade, which generated a large population of chronically ill patients. This study established the incidence of prolonged mechanical ventilation in four intensive care units and reported different characteristics, hospital outcomes, and the impact of costs and services of prolonged mechanical ventilation patients (mechanical ventilation dependency ≥ 21 days) compared with non-prolonged mechanical ventilation patients (mechanical ventilation dependency < 21 days).
Methods:
This study was a multicenter cohort study of all patients who were admitted to four intensive care units. The main outcome measures were length of stay in the intensive care unit, hospital, complications during intensive care unit stay, and intensive care unit and hospital mortality.
Results:
There were 5,287 admissions to the intensive care units during study period. Some of these patients (41.5%) needed ventilatory support (n = 2,197), and 218 of the patients met criteria for prolonged mechanical ventilation (9.9%). Some complications developed during intensive care unit stay, such as muscle weakness, pressure ulcers, bacterial nosocomial sepsis, candidemia, pulmonary embolism, and hyperactive delirium, were associated with a significantly higher risk of prolonged mechanical ventilation. Prolonged mechanical ventilation patients had a significant increase in intensive care unit mortality (absolute difference = 14.2%, p < 0.001) and hospital mortality (absolute difference = 19.1%, p < 0.001). The prolonged mechanical ventilation group spent more days in the hospital after intensive care unit discharge (26.9 ± 29.3 versus 10.3 ± 20.4 days, p < 0.001) with higher costs.
Conclusion:
The classification of chronically critically ill patients according to the definition of prolonged mechanical ventilation adopted by our study (mechanical ventilation dependency ≥ 21 days) identified patients with a high risk for complications during intensive care unit stay, longer intensive care unit and hospital stays, high death rates, and higher costs.
-
Original Article
Analysis of COVID-19 under-reporting in Brazil
- Marcelo Freitas do Prado,
- Bianca Brandão de Paula Antunes ,
- Leonardo dos Santos Lourenço Bastos,
- Igor Tona Peres,
- Amanda de Araújo Batista da Silva, [ … ],
- Fernando Augusto Bozza
Abstract
Original ArticleAnalysis of COVID-19 under-reporting in Brazil
Rev Bras Ter Intensiva. 2020;32(2):224-228
DOI 10.5935/0103-507X.20200030
- Marcelo Freitas do Prado,
- Bianca Brandão de Paula Antunes ,
- Leonardo dos Santos Lourenço Bastos,
- Igor Tona Peres,
- Amanda de Araújo Batista da Silva,
- Leila Figueiredo Dantas ,
- Fernanda Araújo Baião ,
- Paula Maçaira ,
- Silvio Hamacher,
- Fernando Augusto Bozza
Views4ABSTRACT
Objective:
To estimate the reporting rates of coronavirus disease 2019 (COVID-19) cases for Brazil as a whole and states.
Methods:
We estimated the actual number of COVID-19 cases using the reported number of deaths in Brazil and each state, and the expected case-fatality ratio from the World Health Organization. Brazil’s expected case-fatality ratio was also adjusted by the population’s age pyramid. Therefore, the notification rate can be defined as the number of confirmed cases (notified by the Ministry of Health) divided by the number of expected cases (estimated from the number of deaths).
Results:
The reporting rate for COVID-19 in Brazil was estimated at 9.2% (95%CI 8.8% – 9.5%), with all the states presenting rates below 30%. São Paulo and Rio de Janeiro, the most populated states in Brazil, showed small reporting rates (8.9% and 7.2%, respectively). The highest reporting rate occurred in Roraima (31.7%) and the lowest in Paraiba (3.4%).
Conclusion:
The results indicated that the reporting of confirmed cases in Brazil is much lower as compared to other countries we analyzed. Therefore, decision-makers, including the government, fail to know the actual dimension of the pandemic, which may interfere with the determination of control measures.
Keywords:BrazilCoronavirus infectionsCOVID-19MortalityPandemics/statistics & numerical dataReporting of healthcare dataSee moreViews4Abstract
Original ArticleAnalysis of COVID-19 under-reporting in Brazil
Rev Bras Ter Intensiva. 2020;32(2):224-228
DOI 10.5935/0103-507X.20200030
- Marcelo Freitas do Prado,
- Bianca Brandão de Paula Antunes ,
- Leonardo dos Santos Lourenço Bastos,
- Igor Tona Peres,
- Amanda de Araújo Batista da Silva,
- Leila Figueiredo Dantas ,
- Fernanda Araújo Baião ,
- Paula Maçaira ,
- Silvio Hamacher,
- Fernando Augusto Bozza
Views4ABSTRACT
Objective:
To estimate the reporting rates of coronavirus disease 2019 (COVID-19) cases for Brazil as a whole and states.
Methods:
We estimated the actual number of COVID-19 cases using the reported number of deaths in Brazil and each state, and the expected case-fatality ratio from the World Health Organization. Brazil’s expected case-fatality ratio was also adjusted by the population’s age pyramid. Therefore, the notification rate can be defined as the number of confirmed cases (notified by the Ministry of Health) divided by the number of expected cases (estimated from the number of deaths).
Results:
The reporting rate for COVID-19 in Brazil was estimated at 9.2% (95%CI 8.8% – 9.5%), with all the states presenting rates below 30%. São Paulo and Rio de Janeiro, the most populated states in Brazil, showed small reporting rates (8.9% and 7.2%, respectively). The highest reporting rate occurred in Roraima (31.7%) and the lowest in Paraiba (3.4%).
Conclusion:
The results indicated that the reporting of confirmed cases in Brazil is much lower as compared to other countries we analyzed. Therefore, decision-makers, including the government, fail to know the actual dimension of the pandemic, which may interfere with the determination of control measures.
Keywords:BrazilCoronavirus infectionsCOVID-19MortalityPandemics/statistics & numerical dataReporting of healthcare dataSee more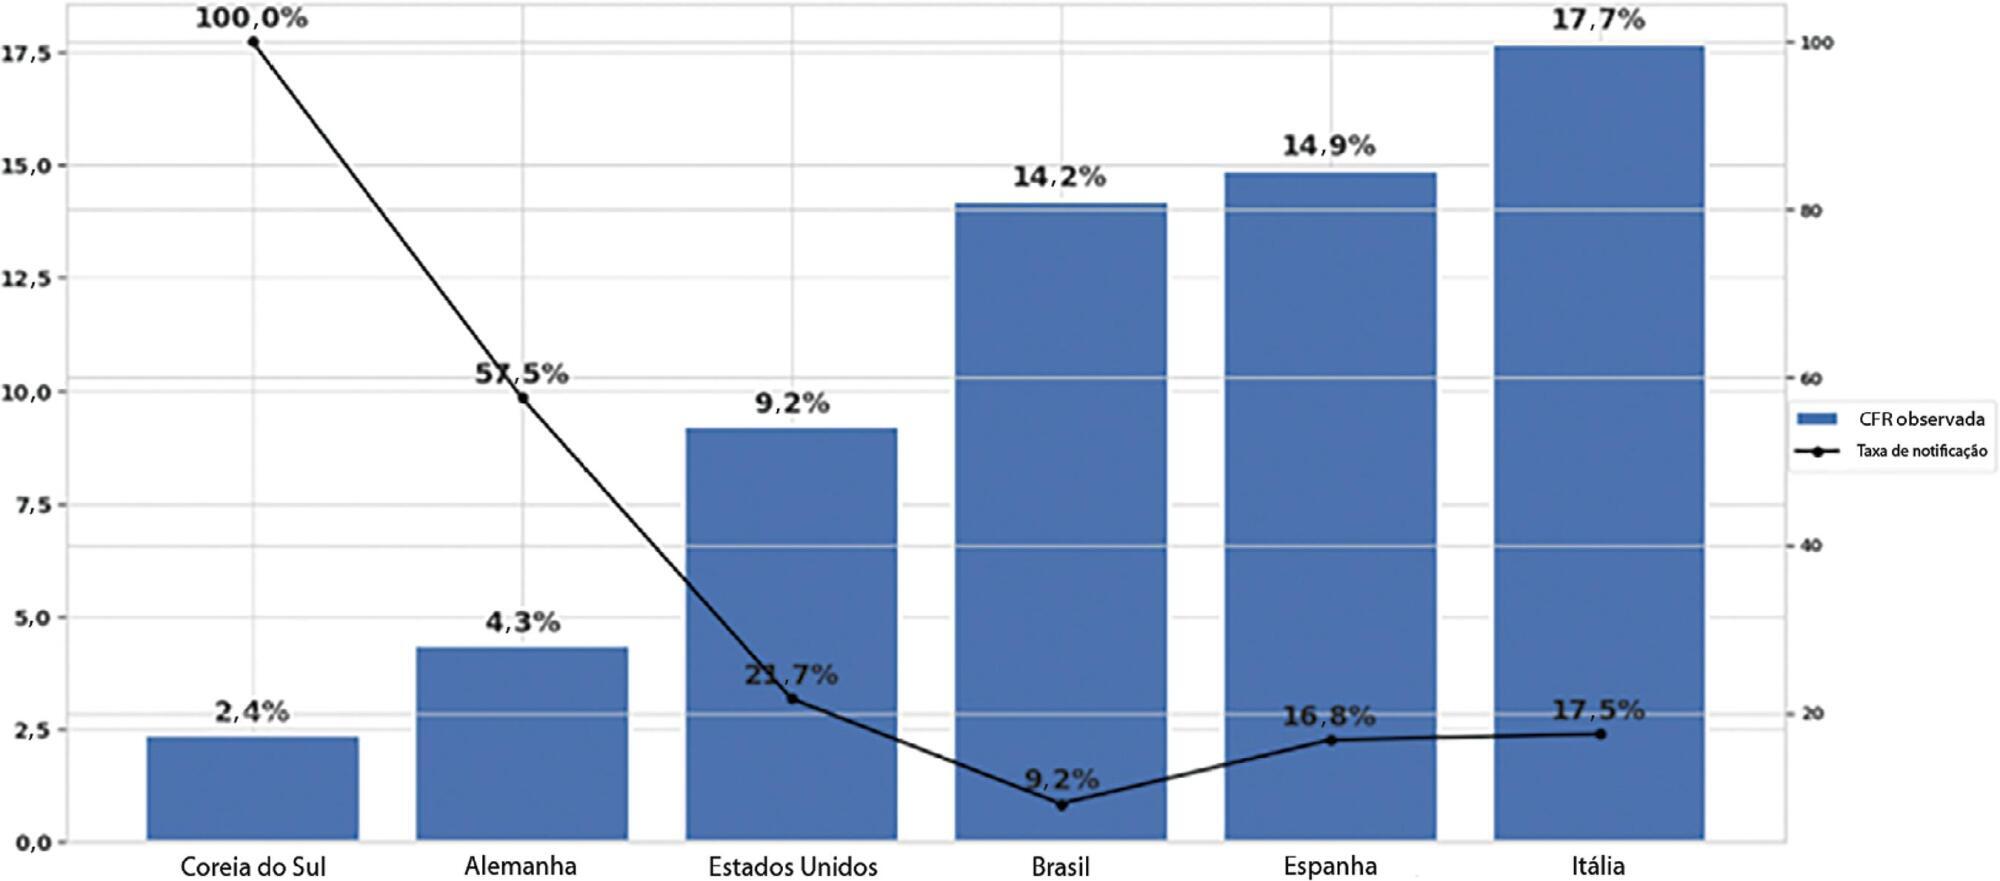
-
Original Articles
Augmented renal clearance in critically ill patients: incidence, associated factors and effects on vancomycin treatment
Rev Bras Ter Intensiva. 2014;26(1):13-20
Abstract
Original ArticlesAugmented renal clearance in critically ill patients: incidence, associated factors and effects on vancomycin treatment
Rev Bras Ter Intensiva. 2014;26(1):13-20
DOI 10.5935/0103-507X.20140003
Views7Objective:
An augmented renal clearance has been described in some groups of critically ill patients, and it might induce sub-optimal concentrations of drugs eliminated by glomerular filtration, mainly antibiotics. Studies on its occurrence and determinants are lacking. Our goals were to determine the incidence and associated factors of augmented renal clearance and the effects on vancomycin concentrations and dosing in a series of intensive care unit patients.
Methods:
We prospectively studied 363 patients admitted during 1 year to a clinical-surgical intensive care unit. Patients with serum creatinine >1.3mg/dL were excluded. Creatinine clearance was calculated from a 24-hour urine collection. Patients were grouped according to the presence of augmented renal clearance (creatinine clearance >120mL/min/1.73m2), and possible risk factors were analyzed with bivariate and logistic regression analysis. In patients treated with vancomycin, dosage and plasma concentrations were registered.
Results:
Augmented renal clearance was present in 103 patients (28%); they were younger (48±15 versus 65±17 years, p<0.0001), had more frequent obstetric (16 versus 7%, p=0.0006) and trauma admissions (10 versus 3%, p=0.016) and fewer comorbidities. The only independent determinants for the development of augmented renal clearance were age (OR 0.95; p<0.0001; 95%CI 0.93-0.96) and absence of diabetes (OR 0.34; p=0.03; 95%CI 0.12-0.92). Twelve of the 46 patients who received vancomycin had augmented renal clearance and despite higher doses, had lower concentrations.
Conclusions:
In this cohort of critically ill patients, augmented renal clearance was a common finding. Age and absence of diabetes were the only independent determinants. Therefore, younger and previously healthy patients might require larger vancomycin dosing.
Keywords:CreatinineMetabolic clearance rateSepsis/drug therapyVancomycin/pharmacokineticsVancomycin/therapeutic useSee moreViews7Abstract
Original ArticlesAugmented renal clearance in critically ill patients: incidence, associated factors and effects on vancomycin treatment
Rev Bras Ter Intensiva. 2014;26(1):13-20
DOI 10.5935/0103-507X.20140003
Views7Objective:
An augmented renal clearance has been described in some groups of critically ill patients, and it might induce sub-optimal concentrations of drugs eliminated by glomerular filtration, mainly antibiotics. Studies on its occurrence and determinants are lacking. Our goals were to determine the incidence and associated factors of augmented renal clearance and the effects on vancomycin concentrations and dosing in a series of intensive care unit patients.
Methods:
We prospectively studied 363 patients admitted during 1 year to a clinical-surgical intensive care unit. Patients with serum creatinine >1.3mg/dL were excluded. Creatinine clearance was calculated from a 24-hour urine collection. Patients were grouped according to the presence of augmented renal clearance (creatinine clearance >120mL/min/1.73m2), and possible risk factors were analyzed with bivariate and logistic regression analysis. In patients treated with vancomycin, dosage and plasma concentrations were registered.
Results:
Augmented renal clearance was present in 103 patients (28%); they were younger (48±15 versus 65±17 years, p<0.0001), had more frequent obstetric (16 versus 7%, p=0.0006) and trauma admissions (10 versus 3%, p=0.016) and fewer comorbidities. The only independent determinants for the development of augmented renal clearance were age (OR 0.95; p<0.0001; 95%CI 0.93-0.96) and absence of diabetes (OR 0.34; p=0.03; 95%CI 0.12-0.92). Twelve of the 46 patients who received vancomycin had augmented renal clearance and despite higher doses, had lower concentrations.
Conclusions:
In this cohort of critically ill patients, augmented renal clearance was a common finding. Age and absence of diabetes were the only independent determinants. Therefore, younger and previously healthy patients might require larger vancomycin dosing.
Keywords:CreatinineMetabolic clearance rateSepsis/drug therapyVancomycin/pharmacokineticsVancomycin/therapeutic useSee more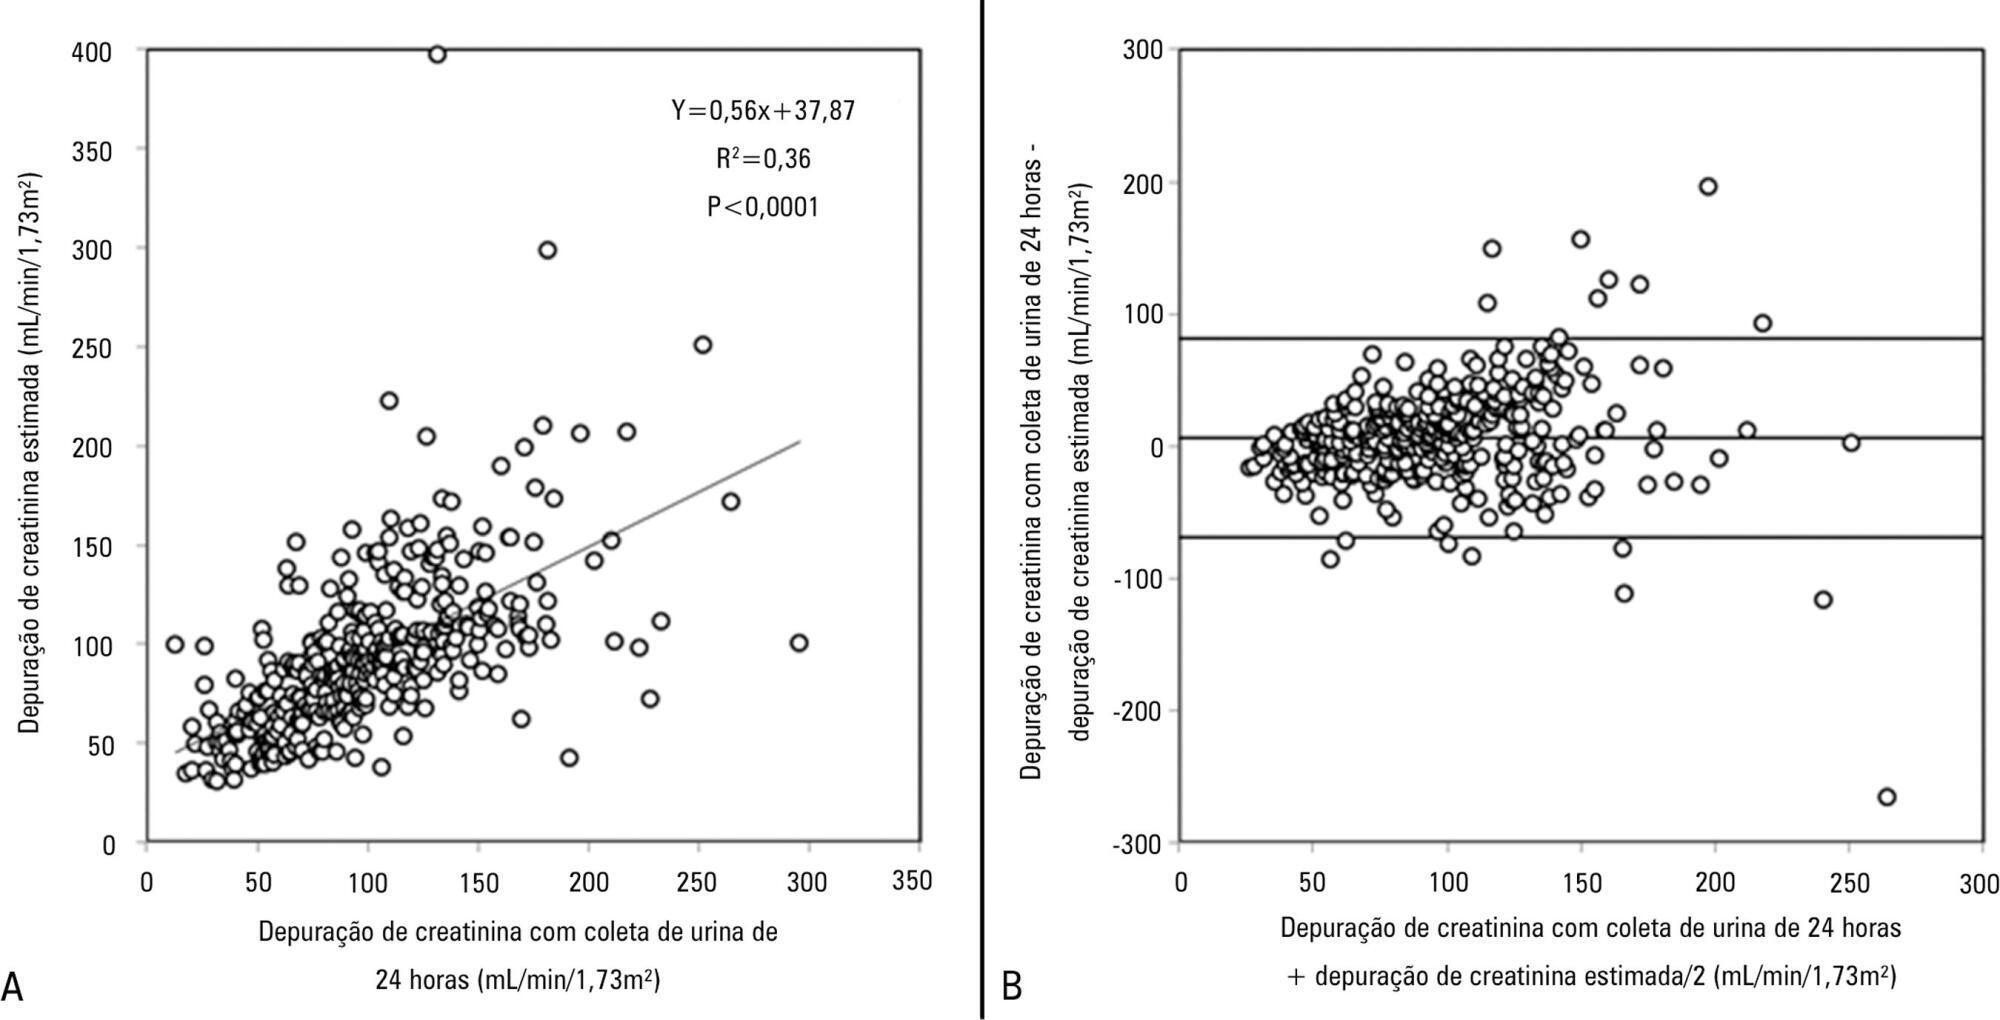
-
Special Article
Brazilian recommendations of mechanical ventilation 2013. Part I
Rev Bras Ter Intensiva. 2014;26(2):89-121
Abstract
Special ArticleBrazilian recommendations of mechanical ventilation 2013. Part I
Rev Bras Ter Intensiva. 2014;26(2):89-121
DOI 10.5935/0103-507X.20140017
Views4See morePerspectives on invasive and noninvasive ventilatory support for critically ill patients are evolving, as much evidence indicates that ventilation may have positive effects on patient survival and the quality of the care provided in intensive care units in Brazil. For those reasons, the Brazilian Association of Intensive Care Medicine (Associação de Medicina Intensiva Brasileira – AMIB) and the Brazilian Thoracic Society (Sociedade Brasileira de Pneumologia e Tisiologia – SBPT), represented by the Mechanical Ventilation Committee and the Commission of Intensive Therapy, respectively, decided to review the literature and draft recommendations for mechanical ventilation with the goal of creating a document for bedside guidance as to the best practices on mechanical ventilation available to their members. The document was based on the available evidence regarding 29 subtopics selected as the most relevant for the subject of interest. The project was developed in several stages, during which the selected topics were distributed among experts recommended by both societies with recent publications on the subject of interest and/or significant teaching and research activity in the field of mechanical ventilation in Brazil. The experts were divided into pairs that were charged with performing a thorough review of the international literature on each topic. All the experts met at the Forum on Mechanical Ventilation, which was held at the headquarters of AMIB in São Paulo on August 3 and 4, 2013, to collaboratively draft the final text corresponding to each sub-topic, which was presented to, appraised, discussed and approved in a plenary session that included all 58 participants and aimed to create the final document.
Views4Abstract
Special ArticleBrazilian recommendations of mechanical ventilation 2013. Part I
Rev Bras Ter Intensiva. 2014;26(2):89-121
DOI 10.5935/0103-507X.20140017
Views4See morePerspectives on invasive and noninvasive ventilatory support for critically ill patients are evolving, as much evidence indicates that ventilation may have positive effects on patient survival and the quality of the care provided in intensive care units in Brazil. For those reasons, the Brazilian Association of Intensive Care Medicine (Associação de Medicina Intensiva Brasileira – AMIB) and the Brazilian Thoracic Society (Sociedade Brasileira de Pneumologia e Tisiologia – SBPT), represented by the Mechanical Ventilation Committee and the Commission of Intensive Therapy, respectively, decided to review the literature and draft recommendations for mechanical ventilation with the goal of creating a document for bedside guidance as to the best practices on mechanical ventilation available to their members. The document was based on the available evidence regarding 29 subtopics selected as the most relevant for the subject of interest. The project was developed in several stages, during which the selected topics were distributed among experts recommended by both societies with recent publications on the subject of interest and/or significant teaching and research activity in the field of mechanical ventilation in Brazil. The experts were divided into pairs that were charged with performing a thorough review of the international literature on each topic. All the experts met at the Forum on Mechanical Ventilation, which was held at the headquarters of AMIB in São Paulo on August 3 and 4, 2013, to collaboratively draft the final text corresponding to each sub-topic, which was presented to, appraised, discussed and approved in a plenary session that included all 58 participants and aimed to create the final document.
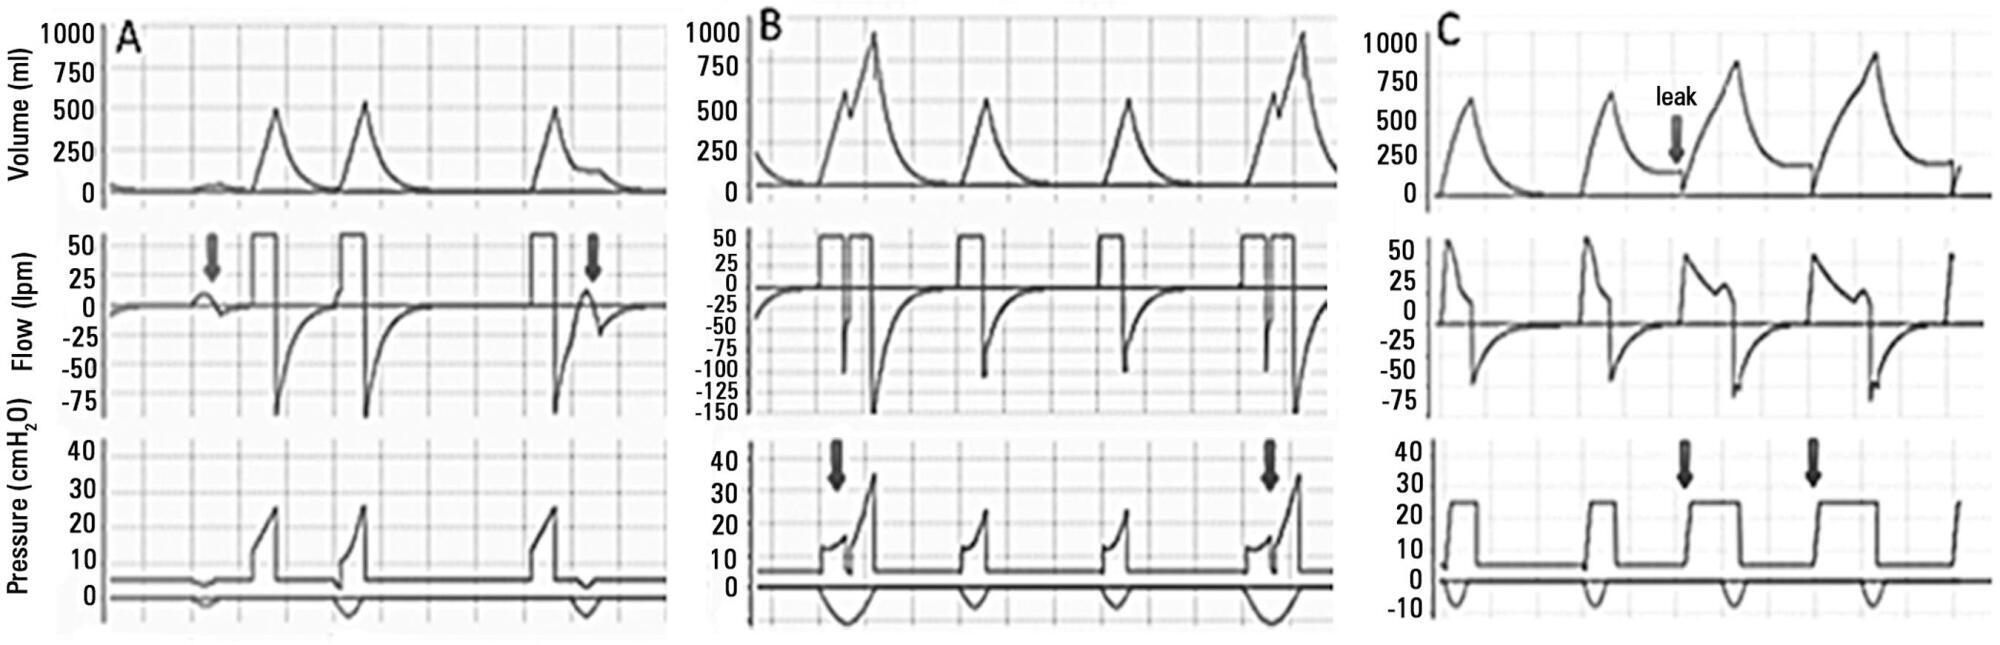
-
Original Articles
Comparison of the RIFLE, AKIN and KDIGO criteria to predict mortality in critically ill patients
Rev Bras Ter Intensiva. 2013;25(4):290-296
Abstract
Original ArticlesComparison of the RIFLE, AKIN and KDIGO criteria to predict mortality in critically ill patients
Rev Bras Ter Intensiva. 2013;25(4):290-296
DOI 10.5935/0103-507X.20130050
Views6See moreObjective:
Acute kidney injury is a common complication in critically ill patients, and the RIFLE, AKIN and KDIGO criteria are used to classify these patients. The present study’s aim was to compare these criteria as predictors of mortality in critically ill patients.
Methods:
Prospective cohort study using medical records as the source of data. All patients admitted to the intensive care unit were included. The exclusion criteria were hospitalization for less than 24 hours and death. Patients were followed until discharge or death. Student’s t test, chi-squared analysis, a multivariate logistic regression and ROC curves were used for the data analysis.
Results:
The mean patient age was 64 years old, and the majority of patients were women of African descent. According to RIFLE, the mortality rates were 17.74%, 22.58%, 24.19% and 35.48% for patients without acute kidney injury (AKI) in stages of Risk, Injury and Failure, respectively. For AKIN, the mortality rates were 17.74%, 29.03%, 12.90% and 40.32% for patients without AKI and at stage I, stage II and stage III, respectively. For KDIGO 2012, the mortality rates were 17.74%, 29.03%, 11.29% and 41.94% for patients without AKI and at stage I, stage II and stage III, respectively. All three classification systems showed similar ROC curves for mortality.
Conclusion:
The RIFLE, AKIN and KDIGO criteria were good tools for predicting mortality in critically ill patients with no significant difference between them.
Views6Abstract
Original ArticlesComparison of the RIFLE, AKIN and KDIGO criteria to predict mortality in critically ill patients
Rev Bras Ter Intensiva. 2013;25(4):290-296
DOI 10.5935/0103-507X.20130050
Views6See moreObjective:
Acute kidney injury is a common complication in critically ill patients, and the RIFLE, AKIN and KDIGO criteria are used to classify these patients. The present study’s aim was to compare these criteria as predictors of mortality in critically ill patients.
Methods:
Prospective cohort study using medical records as the source of data. All patients admitted to the intensive care unit were included. The exclusion criteria were hospitalization for less than 24 hours and death. Patients were followed until discharge or death. Student’s t test, chi-squared analysis, a multivariate logistic regression and ROC curves were used for the data analysis.
Results:
The mean patient age was 64 years old, and the majority of patients were women of African descent. According to RIFLE, the mortality rates were 17.74%, 22.58%, 24.19% and 35.48% for patients without acute kidney injury (AKI) in stages of Risk, Injury and Failure, respectively. For AKIN, the mortality rates were 17.74%, 29.03%, 12.90% and 40.32% for patients without AKI and at stage I, stage II and stage III, respectively. For KDIGO 2012, the mortality rates were 17.74%, 29.03%, 11.29% and 41.94% for patients without AKI and at stage I, stage II and stage III, respectively. All three classification systems showed similar ROC curves for mortality.
Conclusion:
The RIFLE, AKIN and KDIGO criteria were good tools for predicting mortality in critically ill patients with no significant difference between them.
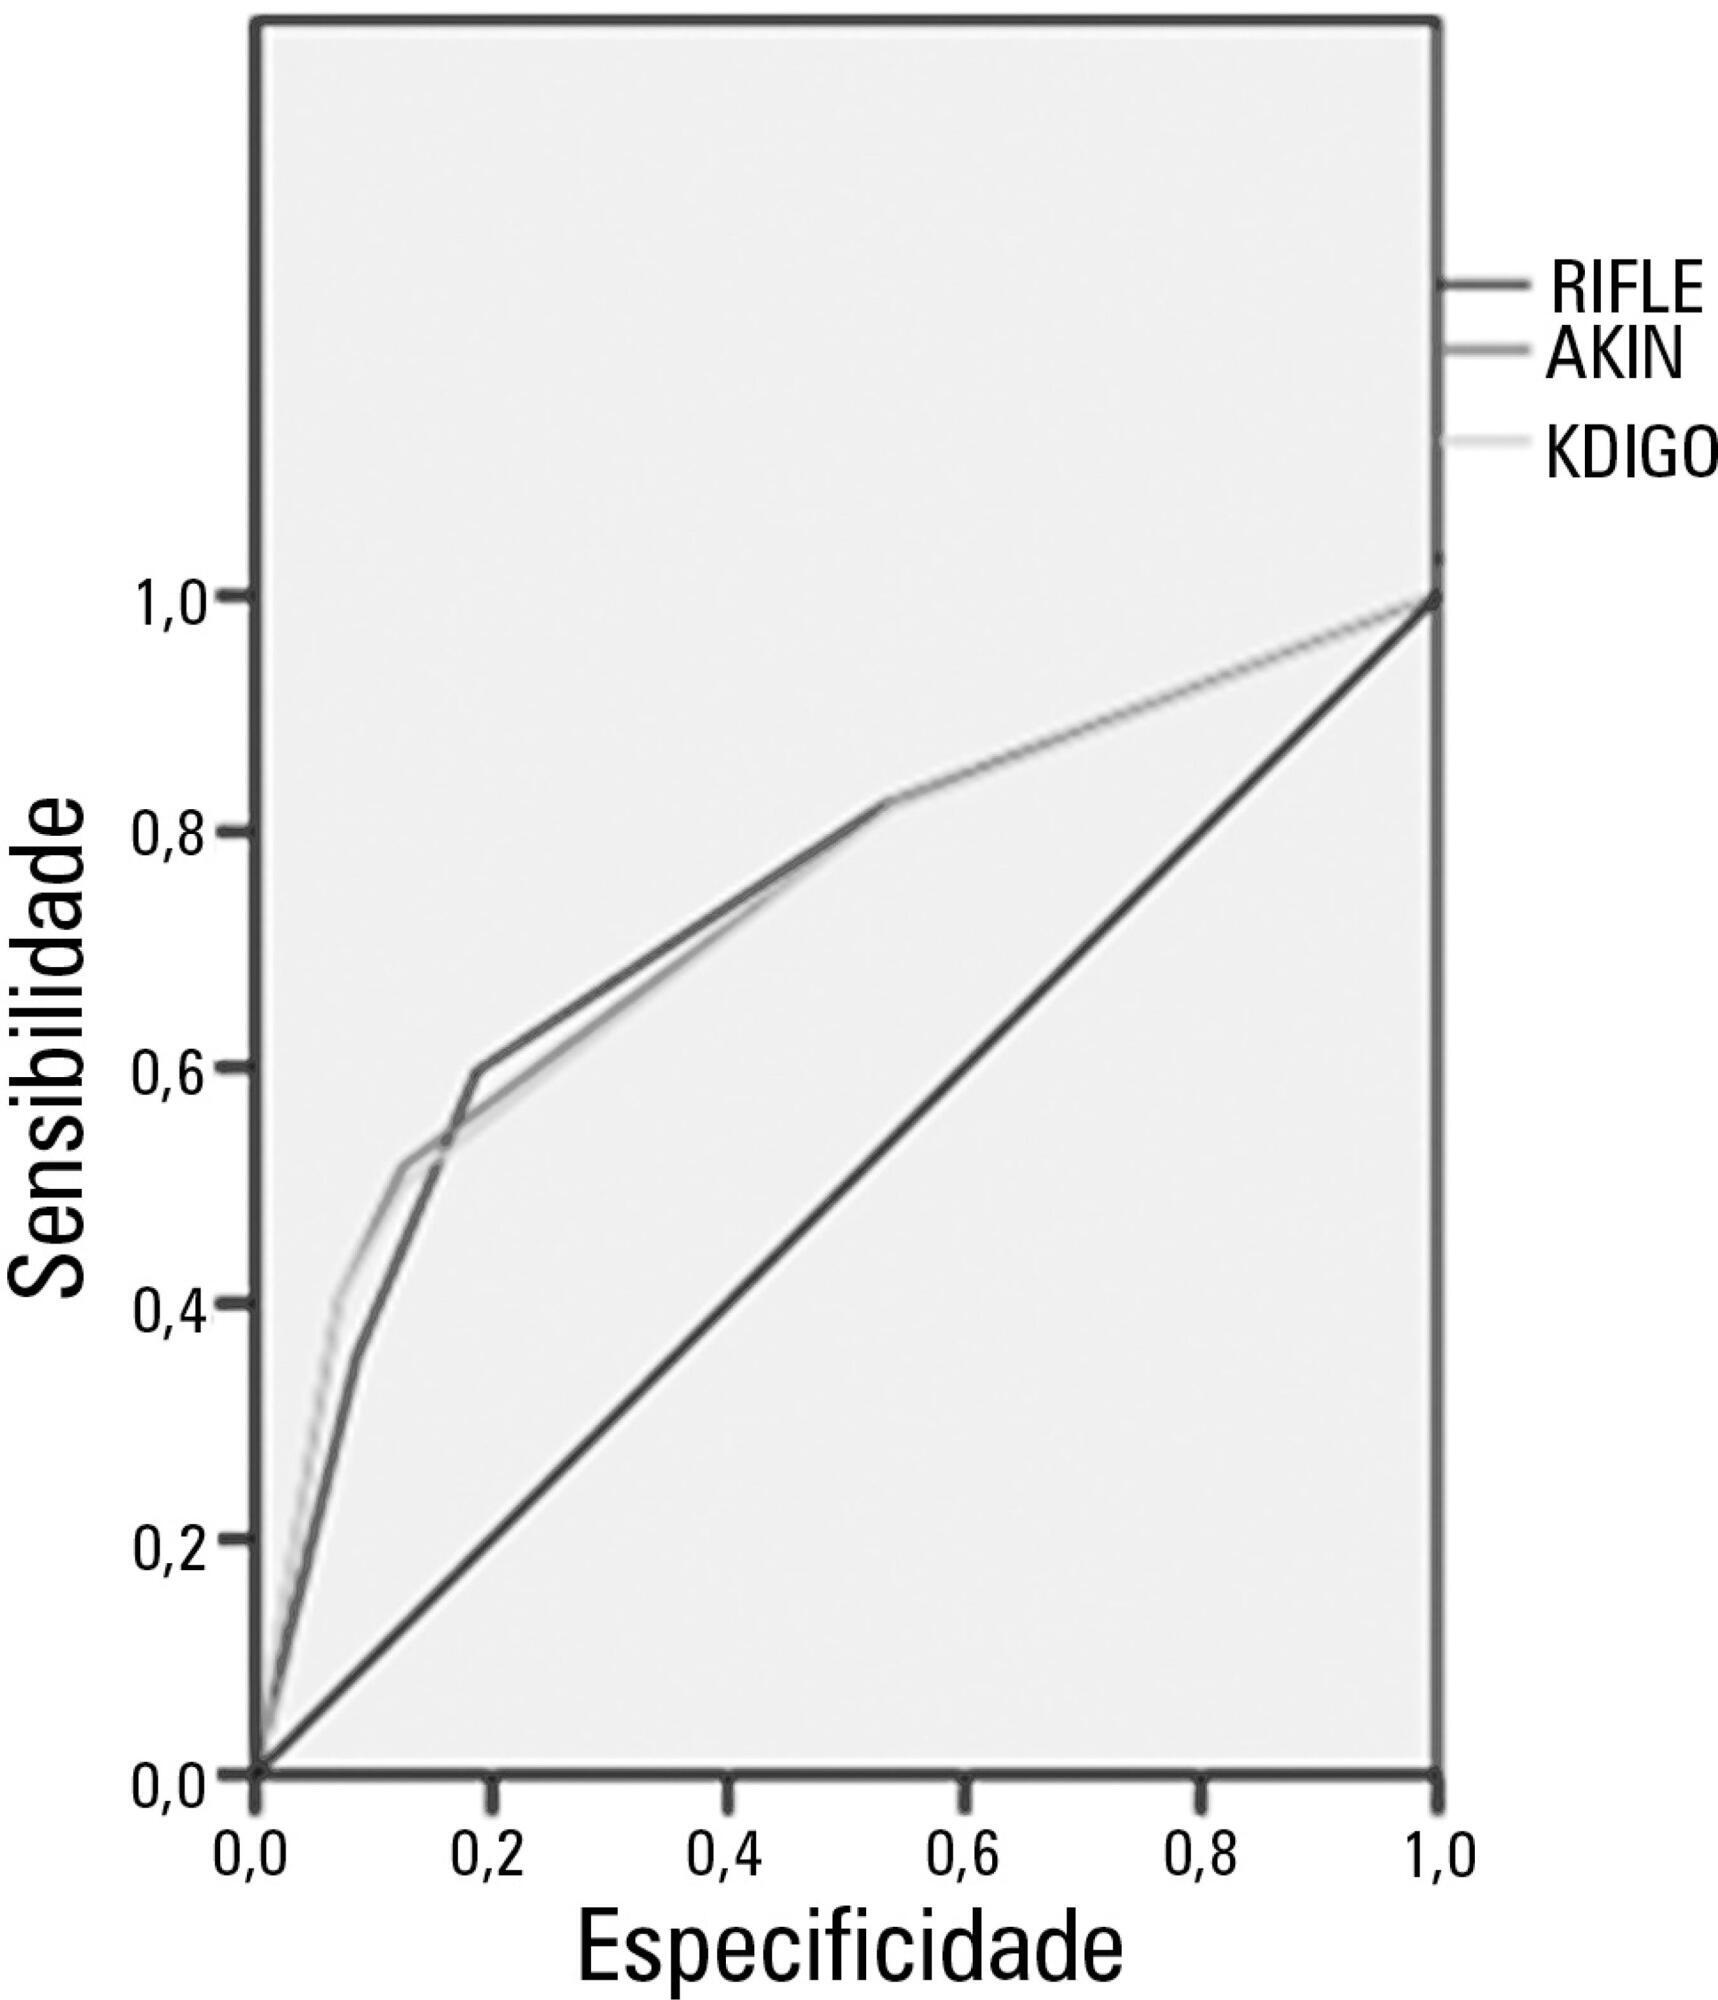
Search
Search in:
KEY WORDS
Case reports Child Coronavirus infections COVID-19 Critical care Critical illness ICU Infant, newborn Intensive care Intensive care units Intensive care units, pediatric mechanical ventilation Mortality Physical therapy modalities Prognosis Respiration, artificial Respiratory insufficiency risk factors SARS-CoV-2 Sepsis
Featured Articles
- Original Article
Conscious prone positioning in nonintubated COVID-19 patients with acute respiratory distress syndrome: systematic review and meta-analysis
- Gustavo Adolfo Vásquez-Tirado ,
- Edinson Dante Meregildo-Rodríguez ,
- Martha Genara Asmat-Rubio ,
- María José Salazar-Castillo ,
- Claudia Vanessa Quispe-Castañeda ,
- María del Carmen Cuadra-Campos
Abstract
Original ArticleConscious prone positioning in nonintubated COVID-19 patients with acute respiratory distress syndrome: systematic review and meta-analysis
Crit Care Sci. 2024;36:e20240176en
DOI 10.62675/2965-2774.20240176-en
- Gustavo Adolfo Vásquez-Tirado ,
- Edinson Dante Meregildo-Rodríguez ,
- Martha Genara Asmat-Rubio ,
- María José Salazar-Castillo ,
- Claudia Vanessa Quispe-Castañeda ,
- María del Carmen Cuadra-Campos
Views101See moreABSTRACT
Objective:
To systematically review the effect of the prone position on endotracheal intubation and mortality in nonintubated COVID-19 patients with acute respiratory distress syndrome.
Methods:
We registered the protocol (CRD42021286711) and searched for four databases and gray literature from inception to December 31, 2022. We included observational studies and clinical trials. There was no limit by date or the language of publication. We excluded case reports, case series, studies not available in full text, and those studies that included children < 18-years-old.
Results:
We included ten observational studies, eight clinical trials, 3,969 patients, 1,120 endotracheal intubation events, and 843 deaths. All of the studies had a low risk of bias (Newcastle-Ottawa Scale and Risk of Bias 2 tools). We found that the conscious prone position decreased the odds of endotracheal intubation by 44% (OR 0.56; 95%CI 0.40 – 0.78) and mortality by 43% (OR 0.57; 95%CI 0.39 – 0.84) in nonintubated COVID-19 patients with acute respiratory distress syndrome. This protective effect on endotracheal intubation and mortality was more robust in those who spent > 8 hours/day in the conscious prone position (OR 0.43; 95%CI 0.26 – 0.72 and OR 0.38; 95%CI 0.24 – 0.60, respectively). The certainty of the evidence according to the GRADE criteria was moderate.
Conclusion:
The conscious prone position decreased the odds of endotracheal intubation and mortality, especially when patients spent over 8 hours/day in the conscious prone position and treatment in the intensive care unit. However, our results should be cautiously interpreted due to limitations in evaluating randomized clinical trials, nonrandomized clinical trials and observational studies. However, despite systematic reviews with meta-analyses of randomized clinical trials, we must keep in mind that these studies remain heterogeneous from a clinical and methodological point of view.
Views101Abstract
Original ArticleConscious prone positioning in nonintubated COVID-19 patients with acute respiratory distress syndrome: systematic review and meta-analysis
Crit Care Sci. 2024;36:e20240176en
DOI 10.62675/2965-2774.20240176-en
- Gustavo Adolfo Vásquez-Tirado ,
- Edinson Dante Meregildo-Rodríguez ,
- Martha Genara Asmat-Rubio ,
- María José Salazar-Castillo ,
- Claudia Vanessa Quispe-Castañeda ,
- María del Carmen Cuadra-Campos
Views101See moreABSTRACT
Objective:
To systematically review the effect of the prone position on endotracheal intubation and mortality in nonintubated COVID-19 patients with acute respiratory distress syndrome.
Methods:
We registered the protocol (CRD42021286711) and searched for four databases and gray literature from inception to December 31, 2022. We included observational studies and clinical trials. There was no limit by date or the language of publication. We excluded case reports, case series, studies not available in full text, and those studies that included children < 18-years-old.
Results:
We included ten observational studies, eight clinical trials, 3,969 patients, 1,120 endotracheal intubation events, and 843 deaths. All of the studies had a low risk of bias (Newcastle-Ottawa Scale and Risk of Bias 2 tools). We found that the conscious prone position decreased the odds of endotracheal intubation by 44% (OR 0.56; 95%CI 0.40 – 0.78) and mortality by 43% (OR 0.57; 95%CI 0.39 – 0.84) in nonintubated COVID-19 patients with acute respiratory distress syndrome. This protective effect on endotracheal intubation and mortality was more robust in those who spent > 8 hours/day in the conscious prone position (OR 0.43; 95%CI 0.26 – 0.72 and OR 0.38; 95%CI 0.24 – 0.60, respectively). The certainty of the evidence according to the GRADE criteria was moderate.
Conclusion:
The conscious prone position decreased the odds of endotracheal intubation and mortality, especially when patients spent over 8 hours/day in the conscious prone position and treatment in the intensive care unit. However, our results should be cautiously interpreted due to limitations in evaluating randomized clinical trials, nonrandomized clinical trials and observational studies. However, despite systematic reviews with meta-analyses of randomized clinical trials, we must keep in mind that these studies remain heterogeneous from a clinical and methodological point of view.
- Gustavo Adolfo Vásquez-Tirado
- Editorial
Open-access publications: a double-edged sword for critical care researchers in lowand middle-income countries
Crit Care Sci. 2023;35(4):342-344Abstract
EditorialOpen-access publications: a double-edged sword for critical care researchers in lowand middle-income countries
Crit Care Sci. 2023;35(4):342-344
DOI 10.5935/2965-2774.20230263-pt
Views36Open access model and lowand middle-income countries Open access journals usually exempt researchers from low-income countries from publication fees, and this exemption seems to favor the publication of articles by researchers from sub-Saharan Africa.() However, producing high-quality scientific research in these settings is challenging and often funded by agencies such as the National Institutes of […]See moreViews36Abstract
EditorialOpen-access publications: a double-edged sword for critical care researchers in lowand middle-income countries
Crit Care Sci. 2023;35(4):342-344
DOI 10.5935/2965-2774.20230263-pt
Views36Open access model and lowand middle-income countries Open access journals usually exempt researchers from low-income countries from publication fees, and this exemption seems to favor the publication of articles by researchers from sub-Saharan Africa.() However, producing high-quality scientific research in these settings is challenging and often funded by agencies such as the National Institutes of […]See more
Have your research published in our journal!
Publish your research in a full open access journal with credibility and high scientific and ethical standards.